HeatmapChart - Heatmap chart appearance and behavior - MATLAB (original) (raw)
Main Content
HeatmapChart Properties
Heatmap chart appearance and behavior
HeatmapChart properties control the appearance and behavior of a HeatmapChart object. By changing property values, you can modify certain aspects of the heatmap chart. For example, you can add a title:
h = heatmap([1 3 5; 2 4 6]); h.Title = 'My Heatmap Title';
Labels
Chart title, specified as a character vector, cell array of character vectors, string array, or categorical array.
Example: h = heatmap(rand(10,10),'Title','My Title Text')
Example: h.Title = 'My Title Text';
To create a multiline title, specify a cell array of character vectors or a string array. Each element in the array corresponds to a line of text.
Example: h.Title = {'My','Title'};
If you specify the title as a categorical array, MATLAB® uses the values in the array, not the categories.
If you create the chart using tabular data, the default chart has an autogenerated title. If you do not want a title, specify ''.
By default, heatmaps support a subset of TeX markup for the text you specify. Use TeX markup to add superscripts and subscripts, modify the font type and color, and include special characters in the text. If you want a TeX markup character in regular text, such as an underscore (_), then insert a backslash (\) before the character you want to include. The backslash is the TeX escape character. For more information, see the Interpreter property of the text object.
XLabel — Label for _x_-axis
character vector | cell array of character vectors | string array | categorical array
Label for the _x_-axis, specified as a character vector, cell array of character vectors, string array, or categorical array.
Example: h = heatmap(rand(10,10),'XLabel','My Label')
Example: h.XLabel = 'My Label';
To create a multiline label, specify a cell array of character vectors or a string array. Each element in the array corresponds to a line of text.
Example: h.XLabel = {'My','Label'};
If you specify the label as a categorical array, MATLAB uses the values in the array, not the categories.
If you create the chart using tabular data, the default chart has an autogenerated label. If you do not want a label, specify''.
By default, heatmaps support a subset of TeX markup for the text you specify. Use TeX markup to add superscripts and subscripts, modify the font type and color, and include special characters in the text. If you want a TeX markup character in regular text, such as an underscore (_), then insert a backslash (\) before the character you want to include. The backslash is the TeX escape character. For more information, see the Interpreter property of the text object.
YLabel — Label for _y_-axis
character vector | cell array of character vectors | string array | categorical array
Label for the _y_-axis, specified as a character vector, cell array of character vectors, string array, or categorical array.
Example: h = heatmap(rand(10,10),'YLabel','My Label')
Example: h.YLabel = 'My Label';
To create a multiline label, specify a cell array of character vectors or a string array. Each element in the array corresponds to a line of text.
Example: h.YLabel = {'My','Label'};
If you specify the label as a categorical array, MATLAB uses the values in the array, not the categories.
If you create the chart using tabular data, the default chart has an autogenerated label. If you do not want a label, specify''.
By default, heatmaps support a subset of TeX markup for the text you specify. Use TeX markup to add superscripts and subscripts, modify the font type and color, and include special characters in the text. If you want a TeX markup character in regular text, such as an underscore (_), then insert a backslash (\) before the character you want to include. The backslash is the TeX escape character. For more information, see the Interpreter property of the text object.
MissingDataLabel — Label for missing data icon
'NaN' (default) | character vector
Label for missing data icon that displays below the colorbar, specified as a character vector. If you do not want a label to display, use an empty character vector ''.
By default, heatmaps support a subset of TeX markup for the text you specify. Use TeX markup to add superscripts and subscripts, modify the font type and color, and include special characters in the text. If you want a TeX markup character in regular text, such as an underscore (_), then insert a backslash (\) before the character you want to include. The backslash is the TeX escape character. For more information, see the Interpreter property of the text object.
Example: h = heatmap(__,'MissingDataLabel','No data')
Example: h.MissingDataLabel = 'No data'
Interpreter — Text interpreter
'tex' (default) | 'latex' | 'none'
Since R2023b
Text interpreter, specified as one of these values:
'tex'— Interpret characters using a subset of TeX markup.'latex'— Interpret characters using LaTeX markup.'none'— Display literal characters.
The heatmap function uses the interpreter when displaying the chart title, axis labels, or any data that includes text or symbols.
TeX Markup
By default, MATLAB supports a subset of TeX markup. Use TeX markup to add superscripts and subscripts, modify the font type and color, and include special characters in the text.
Modifiers remain in effect until the end of the text. Superscripts and subscripts are an exception because they modify only the next character or the characters within the curly braces. When you set the interpreter to 'tex', the supported modifiers are as follows.
| Modifier | Description | Example |
|---|---|---|
| ^{ } | Superscript | 'text^{superscript}' |
| _{ } | Subscript | 'text_{subscript}' |
| \bf | Bold font | '\bf text' |
| \it | Italic font | '\it text' |
| \sl | Oblique font (usually the same as italic font) | '\sl text' |
| \rm | Normal font | '\rm text' |
| \fontname{specifier} | Font name — Replace_specifier_ with the name of a font family. You can use this in combination with other modifiers. | '\fontname{Courier} text' |
| \fontsize{specifier} | Font size —Replace_specifier_ with a numeric scalar value in point units. | '\fontsize{15} text' |
| \color{specifier} | Font color — Replace_specifier_ with one of these colors: red, green,yellow, magenta,blue, black,white, gray,darkGreen, orange, orlightBlue. | '\color{magenta} text' |
| \color[rgb]{specifier} | Custom font color — Replace_specifier_ with a three-element RGB triplet. | '\color[rgb]{0,0.5,0.5} text' |
This table lists the supported special characters for the'tex' interpreter.
| Character Sequence | Symbol | Character Sequence | Symbol | Character Sequence | Symbol |
|---|---|---|---|---|---|
| \alpha | α | \upsilon | υ | \sim | ~ |
| \angle | ∠ | \phi | ϕ | \leq | ≤ |
| \ast | * | \chi | χ | \infty | ∞ |
| \beta | β | \psi | ψ | \clubsuit | ♣ |
| \gamma | γ | \omega | ω | \diamondsuit | ♦ |
| \delta | δ | \Gamma | Γ | \heartsuit | ♥ |
| \epsilon | ϵ | \Delta | Δ | \spadesuit | ♠ |
| \zeta | ζ | \Theta | Θ | \leftrightarrow | ↔ |
| \eta | η | \Lambda | Λ | \leftarrow | ← |
| \theta | θ | \Xi | Ξ | \Leftarrow | ⇐ |
| \vartheta | ϑ | \Pi | Π | \uparrow | ↑ |
| \iota | ι | \Sigma | Σ | \rightarrow | → |
| \kappa | κ | \Upsilon | ϒ | \Rightarrow | ⇒ |
| \lambda | λ | \Phi | Φ | \downarrow | ↓ |
| \mu | µ | \Psi | Ψ | \circ | º |
| \nu | ν | \Omega | Ω | \pm | ± |
| \xi | ξ | \forall | ∀ | \geq | ≥ |
| \pi | π | \exists | ∃ | \propto | ∝ |
| \rho | ρ | \ni | ∍ | \partial | ∂ |
| \sigma | σ | \cong | ≅ | \bullet | • |
| \varsigma | ς | \approx | ≈ | \div | ÷ |
| \tau | τ | \Re | ℜ | \neq | ≠ |
| \equiv | ≡ | \oplus | ⊕ | \aleph | ℵ |
| \Im | ℑ | \cup | ∪ | \wp | ℘ |
| \otimes | ⊗ | \subseteq | ⊆ | \oslash | ∅ |
| \cap | ∩ | \in | ∈ | \supseteq | ⊇ |
| \supset | ⊃ | \lceil | ⌈ | \subset | ⊂ |
| \int | ∫ | \cdot | · | \o | ο |
| \rfloor | ⌋ | \neg | ¬ | \nabla | ∇ |
| \lfloor | ⌊ | \times | x | \ldots | ... |
| \perp | ⊥ | \surd | √ | \prime | ´ |
| \wedge | ∧ | \varpi | ϖ | \0 | ∅ |
| \rceil | ⌉ | \rangle | 〉 | \mid | | |
| \vee | ∨ | \langle | 〈 | \copyright | © |
LaTeX Markup
To use LaTeX markup, set the interpreter to'latex'. For inline mode, surround the markup with single dollar signs ($). For display mode, surround the markup with double dollar signs ($$).
| LaTeX Mode | Example | Result |
|---|---|---|
| Inline | '$\int_1^{20} x^2 dx$' |  |
| Display | '$$\int_1^{20} x^2 dx$$' |  |
The displayed text uses the default LaTeX font style. To change the font style, use LaTeX markup.
The maximum size of the text that you can use with the LaTeX interpreter is 1200 characters. For multiline text, this reduces by about 10 characters per line.
For examples that use TeX and LaTeX, see Greek Letters and Special Characters in Chart Text. For more information about the LaTeX system, see The LaTeX Project website at https://www.latex-project.org/.
Color and Styling
Colormap — Colormap for coloring heatmap cells
predefined colormap name | m-by-3 array of RGB triplets
Colormap for coloring heatmap cells, specified as a predefined colormap name or an m-by-3 array of RGB (red, green, blue) triplets that define m individual colors. You can specify one of the predefined colormaps, or you can create a custom one.
- Predefined colormaps — Specify the colormap name in command form, such as
parulaorsummer. For a full list of options, seecolormap. - Custom colormap — Specify an
m-by-3 array of RGB triplets.
Example: h = heatmap(__,'Colormap',summer)
Example: h.Colormap = parula
Method to calculate the color data values (stored in ColorData), specified as 'count', 'mean', 'median','sum', 'max', 'min', or'none'.
If you do not want to use a third variable from the table for the color data, then specify the method as 'count'. When the method is 'count', the heatmap does not use the ColorVariable property and instead counts the number of times each pair of x and y values appears in the source table. This value is the default value when you are using tabular data and do not specify the ColorVariable parameter.
If you want to use a third variable from the table for the color data, then set the ColorVariable property to the variable you want and specify the ColorMethod property as one of the methods listed in this table. For each pair of x and y values, the methods use the corresponding values in the ColorVariable column of the source table to calculate the data.
| Method | Description |
|---|---|
| 'mean' | Calculate the average value. This value is the default value when you specify the ColorVariable property. |
| 'median' | Calculate the median value. |
| 'sum' | Sum the values. |
| 'max' | Use the maximum value. |
| 'min' | Use the minimum value. |
| 'none' | Use the value exactly. The table cannot contain more than one instance of each pair of_x_ and y values. This value is the default value when using matrix data. |
If you want to compute your own matrix of aggregated data, use the accumarray function. Specify the matrix as input to the heatmap function.
Example: h = heatmap(__,'ColorMethod','median')
Example: h.ColorMethod = 'median'
ColorScaling — Mapping of color data to colormap colors
'scaled' (default) | 'scaledcolumns' | 'scaledrows' | 'log'
Mapping of color data to colormap colors, specified as one of these values:
'scaled'— Map values in theColorDataproperty that are less than or equal to the minimum color limit to the first color in the colormap. Map values greater than or equal to the maximum color limit to the last color. TheColorLimitsproperty contains the color limit values.'scaledcolumns'— Normalize each column in theColorDataproperty to values from 0 through 1. Map the smallest value to the first color in the colormap and the largest value to the last color. If all the values in a column are the same, then the heatmap uses the middle color of the colormap.'scaledrows'— Normalize each row in theColorDataproperty to values from 0 to 1. Map the smallest value to the first color in the colormap and the largest value to the last color. If all the values in a row are the same, then the heatmap uses the middle color of the colormap.'log'— Calculate the log of each value in theColorDataproperty before mapping the values to colors in the colormap. Negative values appear as missing data. However, if all the values are negative, then this option uses-log(-value).
The heatmap ignores NaN, Inf, and-Inf values when determining the color scaling.
When ColorScaling is set to'scaledcolumns' or 'scaledrows', the default tick labels on the colorbar range from 0 to 1. The smallest value within a column or row of the heatmap chart maps to 0 on the colorbar. The largest value within a column or row maps to 1 on the colorbar.
Example: h = heatmap(__,'ColorScaling','scaledcolumns')
Example: h.ColorScaling = 'scaledcolumns'
ColorLimits — Color limits
two-element vector
Color limits, specified as a two-element vector of the form [min max]. The color limits indicate the color data values that map to the first and last colors in the colormap.
Note
The default values of min andmax reflect the range of your data after theColorScaling option is applied.
Example: h = heatmap(__,'ColorLimits',[0 10])
Example: h.ColorLimits = [0 10]
MissingDataColor — Color for cells with no data value
[0.1500 0.1500 0.1500] (default) | RGB triplet | hexadecimal color code | 'r' | 'g' | 'b' | ...
Color for cells with no data value, specified as an RGB triplet, a hexadecimal color code, a color name, or a short name.
RGB triplets and hexadecimal color codes are useful for specifying custom colors.
- An RGB triplet is a three-element row vector whose elements specify the intensities of the red, green, and blue components of the color. The intensities must be in the range
[0,1]; for example,[0.4 0.6 0.7]. - A hexadecimal color code is a character vector or a string scalar that starts with a hash symbol (
#) followed by three or six hexadecimal digits, which can range from0toF. The values are not case sensitive. Thus, the color codes"#FF8800","#ff8800","#F80", and"#f80"are equivalent.
Alternatively, you can specify some common colors by name. This table lists the named color options, the equivalent RGB triplets, and hexadecimal color codes.
| Color Name | Short Name | RGB Triplet | Hexadecimal Color Code | Appearance |
|---|---|---|---|---|
| "red" | "r" | [1 0 0] | "#FF0000" |  |
| "green" | "g" | [0 1 0] | "#00FF00" |  |
| "blue" | "b" | [0 0 1] | "#0000FF" |  |
| "cyan" | "c" | [0 1 1] | "#00FFFF" |  |
| "magenta" | "m" | [1 0 1] | "#FF00FF" |  |
| "yellow" | "y" | [1 1 0] | "#FFFF00" |  |
| "black" | "k" | [0 0 0] | "#000000" |  |
| "white" | "w" | [1 1 1] | "#FFFFFF" |  |
Here are the RGB triplets and hexadecimal color codes for the default colors MATLAB uses in many types of plots.
| RGB Triplet | Hexadecimal Color Code | Appearance |
|---|---|---|
| [0 0.4470 0.7410] | "#0072BD" | ![Sample of RGB triplet [0 0.4470 0.7410], which appears as dark blue](https://www.mathworks.com/help/matlab/ref/colororder1.png) |
| [0.8500 0.3250 0.0980] | "#D95319" | ![Sample of RGB triplet [0.8500 0.3250 0.0980], which appears as dark orange](https://www.mathworks.com/help/matlab/ref/colororder2.png) |
| [0.9290 0.6940 0.1250] | "#EDB120" | ![Sample of RGB triplet [0.9290 0.6940 0.1250], which appears as dark yellow](https://www.mathworks.com/help/matlab/ref/colororder3.png) |
| [0.4940 0.1840 0.5560] | "#7E2F8E" | ![Sample of RGB triplet [0.4940 0.1840 0.5560], which appears as dark purple](https://www.mathworks.com/help/matlab/ref/colororder4.png) |
| [0.4660 0.6740 0.1880] | "#77AC30" | ![Sample of RGB triplet [0.4660 0.6740 0.1880], which appears as medium green](https://www.mathworks.com/help/matlab/ref/colororder5.png) |
| [0.3010 0.7450 0.9330] | "#4DBEEE" | ![Sample of RGB triplet [0.3010 0.7450 0.9330], which appears as light blue](https://www.mathworks.com/help/matlab/ref/colororder6.png) |
| [0.6350 0.0780 0.1840] | "#A2142F" | ![Sample of RGB triplet [0.6350 0.0780 0.1840], which appears as dark red](https://www.mathworks.com/help/matlab/ref/colororder7.png) |
Example: h = heatmap(__,'MissingDataColor',[0.8 0.8 0.8])
Example: h.MissingDataColor = [0.8 0.8 0.8]
ColorbarVisible — Display the colorbar
'on' (default) | on/off logical value
Display the colorbar, specified as 'on' or'off', or as numeric or logical 1 (true) or 0 (false). A value of 'on' is equivalent to true, and 'off' is equivalent to false. Thus, you can use the value of this property as a logical value. The value is stored as an on/off logical value of type matlab.lang.OnOffSwitchState.
Example: h = heatmap(__,'ColorbarVisible','off')
Example: h.ColorbarVisible = 'off'
GridVisible — Display grid lines
'on' (default) | on/off logical value
Display grid lines, specified as 'on' or'off', or as numeric or logical 1 (true) or 0 (false). A value of 'on' is equivalent to true, and 'off' is equivalent to false. Thus, you can use the value of this property as a logical value. The value is stored as an on/off logical value of type matlab.lang.OnOffSwitchState.
Example: h = heatmap(__,'GridVisible','off')
Example: h.GridVisible = 'off'
CellLabelColor — Text color for data labels
'auto' (default) | RGB triplet | hexadecimal color code | 'r' | 'g' | 'b' | ...
Text color for data labels, specified as 'auto', an RGB triplet, a hexadecimal color code, a color name, or a short name. The default value of 'auto' chooses an appropriate text color, depending on the color of each heatmap cell. If you do not want the labels to display, specify 'none'.
RGB triplets and hexadecimal color codes are useful for specifying custom colors.
- An RGB triplet is a three-element row vector whose elements specify the intensities of the red, green, and blue components of the color. The intensities must be in the range
[0,1]; for example,[0.4 0.6 0.7]. - A hexadecimal color code is a character vector or a string scalar that starts with a hash symbol (
#) followed by three or six hexadecimal digits, which can range from0toF. The values are not case sensitive. Thus, the color codes"#FF8800","#ff8800","#F80", and"#f80"are equivalent.
Alternatively, you can specify some common colors by name. This table lists the named color options, the equivalent RGB triplets, and hexadecimal color codes.
| Color Name | Short Name | RGB Triplet | Hexadecimal Color Code | Appearance |
|---|---|---|---|---|
| "red" | "r" | [1 0 0] | "#FF0000" | |
| "green" | "g" | [0 1 0] | "#00FF00" | |
| "blue" | "b" | [0 0 1] | "#0000FF" | |
| "cyan" | "c" | [0 1 1] | "#00FFFF" | |
| "magenta" | "m" | [1 0 1] | "#FF00FF" | |
| "yellow" | "y" | [1 1 0] | "#FFFF00" | |
| "black" | "k" | [0 0 0] | "#000000" | |
| "white" | "w" | [1 1 1] | "#FFFFFF" | |
Here are the RGB triplets and hexadecimal color codes for the default colors MATLAB uses in many types of plots.
| RGB Triplet | Hexadecimal Color Code | Appearance |
|---|---|---|
| [0 0.4470 0.7410] | "#0072BD" | |
| [0.8500 0.3250 0.0980] | "#D95319" | |
| [0.9290 0.6940 0.1250] | "#EDB120" | |
| [0.4940 0.1840 0.5560] | "#7E2F8E" | |
| [0.4660 0.6740 0.1880] | "#77AC30" | |
| [0.3010 0.7450 0.9330] | "#4DBEEE" | |
| [0.6350 0.0780 0.1840] | "#A2142F" | |
Example: h = heatmap(__,'CellLabelColor','blue')
Example: h.CellLabelColor = 'blue'
CellLabelFormat — Format for data labels
'%0.4g' (default) | character vector of format options
Format for data labels, specified as a character vector of format options.
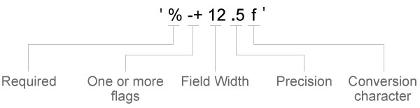
Most elements of the character vector are optional, except the percent sign and conversion character. Construct the character vector in this order:
- One or more flags — Options. For example, add a plus sign before positive values. For a full list of options, see the table of Optional Flags.
- Field width — Minimum number of characters to print in the tick label. Specify the field width as an integer value. If the number of significant digits in the tick value is smaller than the field width, then the label is padded with spaces.
- Precision — Number of digits to the right of the decimal point or the number of significant digits, depending on the conversion character. Specify the precision as an integer value.
- Conversion character — Value type. For a full list of options, see the table of Conversion Characters. If you specify a conversion that does not fit the data, then MATLAB overrides the specified conversion, and uses
%e.
Also, you can specify literal text at the beginning or end of the format. To print a single quotation mark, use ''. To print a percent character, use %%.
Example: h.CellLabelFormat = '%.2f' displays the values using fixed-point notation with two decimal places.
Example: h.CellLabelFormat ='$%.2f' displays a dollar sign before each value.
Example: h.CellLabelFormat = '%.2f lbs' displayslbs after each value.
Optional Flags
| Identifier | Description | Example of Numeric Format |
|---|---|---|
| + | Print the sign character (+) for positive values, such as'+100'. | '%+4.4g' |
| 0 | Pad the field width with leading zeros instead of spaces, such as '0100'. | '%04.4g' |
| – | Left justify, which pads the end of the value with spaces instead of the beginning. For example, if the field width is4, then this flag formats the label as '100 ' instead of ' 100'. | '%-4.4g' |
| # | For the %f,%e, and %g conversion characters, print the decimal point even when the precision is 0, such as '100.'. For %g, do not remove trailing zeros. | '%#4.4g' |
Conversion Characters
| Identifier | Description | Example |
|---|---|---|
| d or i | Signed integer with base 10. The precision value indicates the number of significant digits. | '%.4d' displays π as0003. |
| f | Fixed-point notation. The precision value indicates the number of decimal places. | '%.4f' displays π as3.1416. |
| e | Exponential notation. The precision value indicates the number of decimal places. | '%.4e' displays π as3.1416x100. |
| g | The more compact version of e orf, with no trailing zeros. The precision value indicates the maximum number of decimal places. | '%.4g' displays π as3.1416. |
FontColor — Text color for title, axis labels, and tick labels
[0.1500 0.1500 0.1500] (default) | color name | RGB triplet
Text color for title, axis labels, and tick labels, specified as a color name or an RGB triplet.
Example: h = heatmap(__,'FontColor','blue')
Example: h.FontColor = 'blue'
Font
FontName — Font name
system supported font name
Font name, specified as a system supported font name. The default font depends on the specific operating system and locale.
Example: h = heatmap(__,'FontName','Cambria')
Example: h.FontName = 'Cambria'
FontSize — Font size
scalar numeric value
Font size used for the title, axis labels, and cell labels, specified as a scalar value. The default font depends on the specific operating system and locale.
The title and axis labels use a slightly larger font size (scaled up by 10%). If there is not enough room to display the text within each cell, then the text might use a smaller font size or the text might not appear.
Example: h = heatmap(__,'FontSize',12)
Example: h.FontSize = 12
Table Data
SourceTable — Source table
table | timetable
Source table, specified as a table or a timetable.
You can create a table from workspace variables using the table function, or you can import data as a table using the readtable function. You can create a timetable from workspace variables using the timetable function.
Note
The property is ignored and read-only when you use matrix data.
XVariable — Table variable for _x_-axis
character vector | string | numeric scalar | logical vector
Table variable for _x_-axis, specified in one of these forms:
- Character vector or string indicating one of the variable names
- Numeric scalar indicating the table variable index
- Logical vector containing one
trueelement
The values associated with your table variable must be grouped into a finite set of discrete categories that the categorical function accepts. If the values are not grouped into a finite set of categories, use the discretize function to group them.
If you set the XVariable property value, then theXData and XDisplayData properties automatically update to appropriate values.
The labels that appear along the _x_-axis are in alphabetical order. You can customize the labels usingXDisplayData, yDisplayData, or categorical arrays. For an example, see Create Heatmap from Tabular Data.
Note
The property is ignored and read-only when you use matrix data.
Example: h.XVariable = 'Location' specifies the variable named 'Location'.
YVariable — Table variable for _y_-axis
character vector | string | numeric scalar | logical vector
Table variable for _y_-axis, specified in one of these forms:
- Character vector or string indicating one of the variable names
- Numeric scalar indicating the table variable index
- Logical vector containing one
trueelement
The values associated with your table variable must be grouped into a finite set of discrete categories that the categorical function accepts. If the values are not grouped into a finite set of categories, use the discretize function to group them.
If you set the YVariable property value, then theYData and YDisplayData properties automatically update to appropriate values.
The labels that appear along the _y_-axis are in alphabetical order. You can customize the labels using categorical arrays. For an example, see Create Heatmap from Tabular Data.
Note
The property is ignored and read-only when you use matrix data.
Example: h.YVariable = 'Location' specifies the variable named 'Location'.
ColorVariable — Table variable for color data
character vector | string | numeric scalar | logical vector
Table variable for color data, specified in one of these forms:
- Character vector or string indicating one of the variable names.
- Numeric scalar indicating the table variable index.
- Logical vector containing one
trueelement.
The values associated with your table variable must be of a numeric type or logical.
When you specify the color variable, MATLAB updates the ColorData property values. Also, the ColorMethod property changes to'mean', unless you previously specified a different value.
Note
This property is ignored and read-only when you use matrix data. It is also ignored when the ColorMethod property is set to'count'.
Example: h = heatmap(__,'ColorVariable','Temperature')
Example: h.ColorVariable = 'Temperature'
Matrix Data
ColorData — Data to color each heatmap cell
matrix of numeric values
Data to color each heatmap cell, specified as a matrix of numeric values.
If you are using tabular data, you cannot set this property. TheColorData values automatically populate based on the table variable you select with the ColorVariable property.
Data Types: double | single | int8 | int16 | int32 | int64 | uint8 | uint16 | uint32 | uint64
XData — x values
cell array of character vectors | string array | categorical array
x values associated with the color data matrix columns, specified as a cell array of character vectors, a string array, or a categorical array. The XDisplayData property controls the order in which the values appear along the _x_-axis in the chart.
If you change the XData property value, then theXDisplayData property automatically updates to appropriate values.
If you are using tabular data, you cannot set this property. TheXData values automatically populate based on the table variable you select with the XVariable property.
Example: h.XData = {'small','large','medium'}
Data Types: char | string | cell | categorical
YData — y values
cell array of character vectors | string array | categorical array
y values associated with the color data matrix rows, specified as a cell array of character vectors, a string array, or a categorical array. The YDisplayData property controls the order in which the values appear along the _y_-axis in the chart.
If you change the YData property value, then theYDisplayData property automatically updates to appropriate values.
If you are using tabular data, you cannot set this property. TheYData values automatically populate based on the table variable you select with the YVariable property.
Example: h.YData = {'small','large','medium'}
Data Types: char | string | cell | categorical
Displayed Data
ColorDisplayData — Sorted color data
matrix
This property is read-only.
Sorted color data, returned as a matrix of values as they appear in the heatmap chart. The values are sorted based on theXDisplayData and YDisplayData properties.
Data Types: double
XDisplayData — Display order of _x_-axis values
cell array of character vectors | string array | categorical array
Display order of _x_-axis values, specified as a cell array of character vectors, a string array, or a categorical array. You can set this property to a subset, superset, or permutation of the values inXData. By default, the values are the same as theXData values.
If you specify a value that is not in XData, then the heatmap shows a row of either NaN values or zeros.
- If the
ColorMethodproperty is'sum'or'count', then the heatmap shows a row of zeros. - If the
ColorMethodproperty is'mean','median', or'none', then the heatmap shows a row ofNaNvalues.
If you want to specify the XDisplayData as a name-value pair during object creation, you must specify theXDisplayData property before specifying theXDisplayLabels or XLimits properties. Use the XDisplayLabels property to change the displayed text.
Example: h.XDisplayData = {'small','medium','large'}
Data Types: char | string | cell | categorical
YDisplayData — Display order of _y_-axis values
cell array of character vectors | string array | categorical array
Display order of _y_-axis values, specified as a cell array of character vectors, a string array, or a categorical array. You can set this property to a subset, superset, or permutation of the values inYData. By default, the values are the same as theYData values.
If you specify a value that is not in YData, then the heatmap shows a row of either NaN values or zeros.
- If the
ColorMethodproperty is'sum'or'count', then the heatmap shows a row of zeros. - If the
ColorMethodproperty is'mean','median', or'none', then the heatmap shows a row ofNaNvalues.
If you want to specify YDisplayData as a name-value pair during object creation, you must specify theYDisplayData property before specifying theYDisplayLabels or YLimits properties. Use the YDisplayLabels property to change the displayed text.
Example: h.YDisplayData = {'small','medium','large'}
Data Types: char | string | cell | categorical
XDisplayLabels — Labels for _x_-axis values
cell array of character vectors | string array | categorical array
Labels for the _x_-axis values, specified as a cell array of character vectors, string array, or categorical array. The array must be a column vector the same size as the XDisplayData vector. Specify one label for each value inXDisplayData. By default, the values are the same as the XDisplayData values. When you specify this property as a categorical array, MATLAB uses the values in the array, not the categories.
If you add a value, delete a value, or rearrange the values in theXDisplayData property, then this property updates accordingly to maintain the pairings of values and labels. If you want to specify both XDisplayLabels andXDisplayData as name-value pairs during object creation, then specify the XDisplayData property first.
By default, heatmaps support a subset of TeX markup for the text you specify. Use TeX markup to add superscripts and subscripts, modify the font type and color, and include special characters in the text. If you want a TeX markup character in regular text, such as an underscore (_), then insert a backslash (\) before the character you want to include. The backslash is the TeX escape character. For more information, see the Interpreter property of the text object.
Example: h.XDisplayLabels = {'SM','MED','LG'}
Data Types: char | string | cell | categorical
YDisplayLabels — Labels for _y_-axis values
cell array of character vectors | string array | categorical array
Labels for the _y_-axis values, specified as a cell array of character vectors, string array, or categorical array. The array must be a column vector the same size as the YDisplayData vector. Specify one label for each value inYDisplayData. By default, the values are the same as the YDisplayData values. When you specify this property as a categorical array, MATLAB uses the values in the array, not the categories.
If you add a value, delete a value, or rearrange the values in theYDisplayData property, then this property updates accordingly to maintain the pairings of values and labels. If you want to specify both YDisplayLabels andYDisplayData as name-value pairs during object creation, then specify the YDisplayData property first.
By default, heatmaps support a subset of TeX markup for the text you specify. Use TeX markup to add superscripts and subscripts, modify the font type and color, and include special characters in the text. If you want a TeX markup character in regular text, such as an underscore (_), then insert a backslash (\) before the character you want to include. The backslash is the TeX escape character. For more information, see the Interpreter property of the text object.
Example: h.YDisplayLabels = {'SM','MED','LG'}
Data Types: char | string | cell | categorical
XLimits — _x_-axis limits
two-element row vector
_x_-axis limits, specified as a two-element row vector of values from XDisplayData.
If you want to specify both XLimits andXDisplayData as name-value pairs during object creation, then specify the XDisplayData property first.
Example: h.XLimits = {'small','medium'}
Data Types: char | string | cell | categorical
YLimits — _y_-axis limits
two-element row vector
_y_-axis limits, specified as a two-element row vector of values from YDisplayData.
If you want to specify both YLimits andYDisplayData as name-value pairs during object creation, then specify the YDisplayData property first.
Example: h.YLimits = {'small','medium'}
Data Types: char | string | cell | categorical
Position
PositionConstraint — Position to hold constant
"outerposition" | "innerposition"
Position property to hold constant when adding, removing, or changing decorations, specified as one of the following values:
"outerposition"— TheOuterPositionproperty remains constant when you add, remove, or change decorations such as a title or an axis label. If any positional adjustments are needed, MATLAB adjusts theInnerPositionproperty."innerposition"— TheInnerPositionproperty remains constant when you add, remove, or change decorations such as a title or an axis label. If any positional adjustments are needed, MATLAB adjusts theOuterPositionproperty.
Note
Setting this property has no effect when the parent container is aTiledChartLayout object.
OuterPosition — Outer size and location
[0 0 1 1] (default) | four-element vector
Outer size and location of the heatmap within the parent container (typically a figure, panel, or tab), specified as a four-element vector of the form [left bottom width height]. The outer position includes the colorbar, title, and axis labels.
- The
leftandbottomelements define the distance from the lower left corner of the container to the lower left corner of the heatmap. - The
widthandheightelements are the heatmap dimensions, which include the heatmap cells, plus a margin for the surrounding text and colorbar.
The default value of [0 0 1 1] covers the whole interior of the container. The units are normalized relative to the size of the container. To change the units, set the Units property.
Note
Setting this property has no effect when the parent container is aTiledChartLayout object.
InnerPosition — Inner size and location
four-element vector
Inner size and location of the heatmap within the parent container (typically a figure, panel, or tab) returned as a four-element vector of the form [left bottom width height]. The inner position does not include the colorbar, title, or axis labels.
- The
leftandbottomelements define the distance from the lower left corner of the container to the lower left corner of the heatmap. - The
widthandheightelements are the heatmap dimensions, which include only the heatmap cells.
Note
Setting this property has no effect when the parent container is aTiledChartLayout object.
Position — Inner size and location
four-element vector
Inner size and location of the heatmap within the parent container (typically a figure, panel, or tab) returned as a four-element vector of the form [left bottom width height]. This property is equivalent to the InnerPosition property.
Note
Setting this property has no effect when the parent container is aTiledChartLayout object.
Units — Position units
'normalized' (default) | 'inches' | 'centimeters' | 'points' | 'pixels' | 'characters'
Position units, specified as one of these values.
| Units | Description |
|---|---|
| 'normalized' (default) | Normalized with respect to the container, which is typically the figure or a panel. The lower left corner of the container maps to (0,0), and the upper right corner maps to(1,1). |
| 'inches' | Inches. |
| 'centimeters' | Centimeters. |
| 'characters' | Based on the default uicontrol font of the graphics root object: Character width = width of letterx.Character height = distance between the baselines of two lines of text. |
| 'points' | Typography points. One point equals 1/72 inch. |
| 'pixels' | Pixels.Starting in R2015b, distances in pixels are independent of your system resolution on Windows® and Macintosh systems: On Windows systems, a pixel is 1/96th of an inch.On Macintosh systems, a pixel is 1/72nd of an inch.On Linux® systems, the size of a pixel is determined by your system resolution. |
When specifying the units as a name-value pair during object creation, you must set the Units property before specifying the properties that you want to use these units, such asOuterPosition.
Layout — Layout options
empty LayoutOptions array (default) | TiledChartLayoutOptions object | GridLayoutOptions object
Layout options, specified as a TiledChartLayoutOptions orGridLayoutOptions object. This property is useful when the chart is either in a tiled chart layout or a grid layout.
To position the chart within the grid of a tiled chart layout, set theTile and TileSpan properties on theTiledChartLayoutOptions object. For example, consider a 3-by-3 tiled chart layout. The layout has a grid of tiles in the center, and four tiles along the outer edges. In practice, the grid is invisible and the outer tiles do not take up space until you populate them with axes or charts.

This code places the chart c in the third tile of the grid.
To make the chart span multiple tiles, specify the TileSpan property as a two-element vector. For example, this chart spans 2 rows and 3 columns of tiles.
c.Layout.TileSpan = [2 3];
To place the chart in one of the surrounding tiles, specify theTile property as "north","south", "east", or "west". For example, setting the value to "east" places the chart in the tile to the right of the grid.
To place the chart into a layout within an app, specify this property as aGridLayoutOptions object. For more information about working with grid layouts in apps, see uigridlayout.
If the chart is not a child of either a tiled chart layout or a grid layout (for example, if it is a child of a figure or panel) then this property is empty and has no effect.
Visible — State of visibility
'on' (default) | on/off logical value
State of visibility, specified as 'on' or'off', or as numeric or logical 1 (true) or 0 (false). A value of 'on' is equivalent to true, and 'off' is equivalent to false. Thus, you can use the value of this property as a logical value. The value is stored as an on/off logical value of type matlab.lang.OnOffSwitchState.
'on'— Display the heatmap.'off'— Hide the heatmap without deleting it. You still can access the properties of an invisibleHeatmapChartobject.
Parent/Child
Parent — Parent container
Figure object | Panel object | Tab object | TiledChartLayout object | GridLayout object
Parent container, specified as a Figure,Panel, Tab,TiledChartLayout, or GridLayout object.
HandleVisibility — Visibility of object handle
'on' (default) | 'off' | 'callback'
Visibility of HeatmapChart object handle in the Children property of the parent, specified as one of these values:
'on'— Object handle is always visible.'off'— Object handle is invisible at all times. This option is useful for preventing unintended changes to the UI by another function. To temporarily hide the handle during the execution of that function, set theHandleVisibilityto'off'.'callback'— Object handle is visible from within callbacks or functions invoked by callbacks, but not from within functions invoked from the command line. This option blocks access to the object at the command-line, but allows callback functions to access it.
If the object is not listed in the Children property of the parent, then functions that obtain object handles by searching the object hierarchy or querying handle properties cannot return it. This includes get, findobj, gca, gcf, gco, newplot, cla, clf, and close.
Hidden object handles are still valid. Set the rootShowHiddenHandles property to'on' to list all object handles, regardless of theirHandleVisibility property setting.
Version History
Introduced in R2017a
R2023b: Control text interpreter for displayed text using the Interpreter property
Display text, such as titles and labels, with TeX markup, LaTeX markup, or no markup by setting the Interpreter property.
R2020a: ActivePositionProperty is not recommended
Starting in R2020a, setting or getting ActivePositionProperty is not recommended. Use the PositionConstraint property instead.
There are no plans to remove ActivePositionProperty at this time, but the property is no longer listed when you call the set,get, or properties functions on the chart object.
To update your code, make these changes:
- Replace all instances of
ActivePositionPropertywithPositionConstraint. - Replace all references to the
"position"option with the"innerposition"option.