Surface - Primitive surface appearance and behavior - MATLAB (original) (raw)
Main Content
Surface Properties
Primitive surface appearance and behavior
Surface properties control the appearance and behavior ofSurface objects. By changing property values, you can modify certain aspects of the surface chart. Use dot notation to query and set properties.
s = surface; c = s.CData; s.CDataMapping = 'direct';
Faces
Face color, specified as one of the values in this table.
| Value | Description |
|---|---|
| 'flat' | Use a different color for each face based on the values in the CData property. First you must specify the CData property as a matrix the same size as ZData. The color value at the first vertex of each face (in the positive x and y directions) determines the color for the entire face. You cannot use this value when the FaceAlpha property is set to 'interp'. 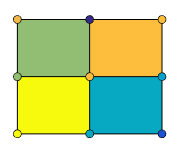 |
| 'interp' | Use interpolated coloring for each face based on the values in theCData property. First you must specify theCData property as a matrix the same size asZData. The color varies across each face by interpolating the color values at the vertices. You cannot use this value when theFaceAlpha property is set to 'flat'. 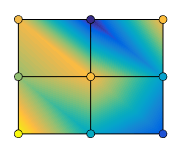 |
| RGB triplet, hexadecimal color code, or color name | Use the specified color for all the faces. This option does not use the color values in the CData property. 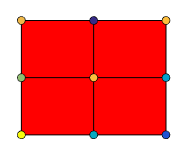 |
| 'texturemap' | Transform the color data in CData so that it conforms to the surface. |
| 'none' | Do not draw the faces. |
RGB triplets and hexadecimal color codes are useful for specifying custom colors.
- An RGB triplet is a three-element row vector whose elements specify the intensities of the red, green, and blue components of the color. The intensities must be in the range
[0,1]; for example,[0.4 0.6 0.7]. - A hexadecimal color code is a character vector or a string scalar that starts with a hash symbol (
#) followed by three or six hexadecimal digits, which can range from0toF. The values are not case sensitive. Thus, the color codes"#FF8800","#ff8800","#F80", and"#f80"are equivalent.
Alternatively, you can specify some common colors by name. This table lists the named color options, the equivalent RGB triplets, and hexadecimal color codes.
| Color Name | Short Name | RGB Triplet | Hexadecimal Color Code | Appearance |
|---|---|---|---|---|
| "red" | "r" | [1 0 0] | "#FF0000" |  |
| "green" | "g" | [0 1 0] | "#00FF00" |  |
| "blue" | "b" | [0 0 1] | "#0000FF" |  |
| "cyan" | "c" | [0 1 1] | "#00FFFF" |  |
| "magenta" | "m" | [1 0 1] | "#FF00FF" |  |
| "yellow" | "y" | [1 1 0] | "#FFFF00" |  |
| "black" | "k" | [0 0 0] | "#000000" |  |
| "white" | "w" | [1 1 1] | "#FFFFFF" |  |
Here are the RGB triplets and hexadecimal color codes for the default colors MATLAB® uses in many types of plots.
| RGB Triplet | Hexadecimal Color Code | Appearance |
|---|---|---|
| [0 0.4470 0.7410] | "#0072BD" | ![Sample of RGB triplet [0 0.4470 0.7410], which appears as dark blue](https://www.mathworks.com/help/matlab/ref/colororder1.png) |
| [0.8500 0.3250 0.0980] | "#D95319" | ![Sample of RGB triplet [0.8500 0.3250 0.0980], which appears as dark orange](https://www.mathworks.com/help/matlab/ref/colororder2.png) |
| [0.9290 0.6940 0.1250] | "#EDB120" | ![Sample of RGB triplet [0.9290 0.6940 0.1250], which appears as dark yellow](https://www.mathworks.com/help/matlab/ref/colororder3.png) |
| [0.4940 0.1840 0.5560] | "#7E2F8E" | ![Sample of RGB triplet [0.4940 0.1840 0.5560], which appears as dark purple](https://www.mathworks.com/help/matlab/ref/colororder4.png) |
| [0.4660 0.6740 0.1880] | "#77AC30" | ![Sample of RGB triplet [0.4660 0.6740 0.1880], which appears as medium green](https://www.mathworks.com/help/matlab/ref/colororder5.png) |
| [0.3010 0.7450 0.9330] | "#4DBEEE" | ![Sample of RGB triplet [0.3010 0.7450 0.9330], which appears as light blue](https://www.mathworks.com/help/matlab/ref/colororder6.png) |
| [0.6350 0.0780 0.1840] | "#A2142F" | ![Sample of RGB triplet [0.6350 0.0780 0.1840], which appears as dark red](https://www.mathworks.com/help/matlab/ref/colororder7.png) |
Face transparency, specified as one of these values:
- Scalar in range
[0,1]— Use uniform transparency across all the faces. A value of1is fully opaque and0is completely transparent. Values between0and1are semitransparent. This option does not use the transparency values in theAlphaDataproperty. 'flat'— Use a different transparency for each face based on the values in theAlphaDataproperty. The transparency value at the first vertex determines the transparency for the entire face. First you must specify theAlphaDataproperty as a matrix the same size as theZDataproperty. TheFaceColorproperty also must be set to'flat'.'interp'— Use interpolated transparency for each face based on the values inAlphaDataproperty. The transparency varies across each face by interpolating the values at the vertices. First you must specify theAlphaDataproperty as a matrix the same size as theZDataproperty. TheFaceColorproperty also must be set to'interp'.'texturemap'— Transform the data inAlphaDataso that it conforms to the surface.
Effect of light objects on faces, specified as one of these values:
'flat'— Apply light uniformly across each face. Use this value to view faceted objects.'gouraud'— Vary the light across the faces. Calculate the light at the vertices and then linearly interpolate the light across the faces. Use this value to view curved surfaces.'none'— Do not apply light from light objects to the faces.
To add a light object to the axes, use the light function.
Note
The 'phong' value has been removed. Use 'gouraud' instead.
Face lighting when the vertex normals point away from camera, specified as one of these values:
'reverselit'— Light the face as if the vertex normal pointed towards the camera.'unlit'— Do not light the face.'lit'— Light the face according to the vertex normal.
Use this property to discriminate between the internal and external surfaces of an object. For an example, see Back Face Lighting.
Edges
Edges to display, specified as 'both', 'row', or 'column'.
Edge line color, specified as one of the values listed here. The default color of [0 0 0] corresponds to black edges.
| Value | Description |
|---|---|
| 'none' | Do not draw the edges. |
| 'flat' | Use a different color for each edge based on the values in the CData property. First you must specify the CData property as a matrix the same size as ZData. The color value at the first vertex of each face (in the positive x and y directions) determines the color for the adjacent edges. You cannot use this value when the EdgeAlpha property is set to 'interp'. 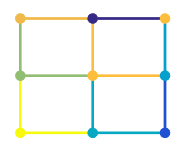 |
| 'interp' | Use interpolated coloring for each edge based on the values in theCData property. First you must specify theCData property as a matrix the same size asZData. The color varies across each edge by linearly interpolating the color values at the vertices. You cannot use this value when theEdgeAlpha property is set to'flat'.  |
| RGB triplet, hexadecimal color code, or color name | Use the specified color for all the edges. This option does not use the color values in the CData property.  |
RGB triplets and hexadecimal color codes are useful for specifying custom colors.
- An RGB triplet is a three-element row vector whose elements specify the intensities of the red, green, and blue components of the color. The intensities must be in the range
[0,1]; for example,[0.4 0.6 0.7]. - A hexadecimal color code is a character vector or a string scalar that starts with a hash symbol (
#) followed by three or six hexadecimal digits, which can range from0toF. The values are not case sensitive. Thus, the color codes"#FF8800","#ff8800","#F80", and"#f80"are equivalent.
Alternatively, you can specify some common colors by name. This table lists the named color options, the equivalent RGB triplets, and hexadecimal color codes.
| Color Name | Short Name | RGB Triplet | Hexadecimal Color Code | Appearance |
|---|---|---|---|---|
| "red" | "r" | [1 0 0] | "#FF0000" | |
| "green" | "g" | [0 1 0] | "#00FF00" | |
| "blue" | "b" | [0 0 1] | "#0000FF" | |
| "cyan" | "c" | [0 1 1] | "#00FFFF" | |
| "magenta" | "m" | [1 0 1] | "#FF00FF" | |
| "yellow" | "y" | [1 1 0] | "#FFFF00" | |
| "black" | "k" | [0 0 0] | "#000000" | |
| "white" | "w" | [1 1 1] | "#FFFFFF" | |
Here are the RGB triplets and hexadecimal color codes for the default colors MATLAB uses in many types of plots.
| RGB Triplet | Hexadecimal Color Code | Appearance |
|---|---|---|
| [0 0.4470 0.7410] | "#0072BD" | |
| [0.8500 0.3250 0.0980] | "#D95319" | |
| [0.9290 0.6940 0.1250] | "#EDB120" | |
| [0.4940 0.1840 0.5560] | "#7E2F8E" | |
| [0.4660 0.6740 0.1880] | "#77AC30" | |
| [0.3010 0.7450 0.9330] | "#4DBEEE" | |
| [0.6350 0.0780 0.1840] | "#A2142F" | |
Edge transparency, specified as one of these values:
- Scalar in range
[0,1]— Use uniform transparency across all of the edges. A value of1is fully opaque and0is completely transparent. Values between0and1are semitransparent. This option does not use the transparency values in theAlphaDataproperty. 'flat'— Use a different transparency for each edge based on the values in theAlphaDataproperty. First you must specify theAlphaDataproperty as a matrix the same size as theZDataproperty. The transparency value at the first vertex determines the transparency for the entire edge. TheEdgeColorproperty also must be set to'flat'.'interp'— Use interpolated transparency for each edge based on the values inAlphaDataproperty. First you must specify theAlphaDataproperty as a matrix the same size as theZDataproperty. The transparency varies across each edge by interpolating the values at the vertices. TheEdgeColorproperty also must be set to'interp'.
Line style, specified as one of the options listed in this table.
| Line Style | Description | Resulting Line |
|---|---|---|
| "-" | Solid line |  |
| "--" | Dashed line |  |
| ":" | Dotted line |  |
| "-." | Dash-dotted line |  |
| "none" | No line | No line |
Line width, specified as a positive value in points, where 1 point = 1/72 of an inch. If the line has markers, then the line width also affects the marker edges.
The line width cannot be thinner than the width of a pixel. If you set the line width to a value that is less than the width of a pixel on your system, the line displays as one pixel wide.
Sharp vertical and horizontal lines, specified as 'on' or'off', or as numeric or logical 1 (true) or 0 (false). A value of 'on' is equivalent to true, and 'off' is equivalent to false. Thus, you can use the value of this property as a logical value. The value is stored as an on/off logical value of type matlab.lang.OnOffSwitchState.
| Value | Description | Appearance |
|---|---|---|
| 'on' | Sharpen vertical and horizontal lines to eliminate an uneven appearance. |  |
| 'off' | Do not sharpen vertical or horizontal lines. The lines might appear uneven in thickness or color. |  |
If the associated figure has a GraphicsSmoothing property set to 'on' and a Renderer property set to'opengl', then the figure applies a smoothing technique to plots. In some cases, this smoothing technique can cause vertical and horizontal lines to appear uneven in thickness or color. Use the AlignVertexCenters property to eliminate the uneven appearance.
Note
You must have a graphics card that supports this feature. To see if the feature is supported, call the rendererinfo function. If it is supported,rendererinfo returns value of 1 forinfo.Details.SupportsAlignVertexCenters.
Effect of light objects on edges, specified as one of these values:
'flat'— Apply light uniformly across the each edges.'none'— Do not apply lights from light objects to the edges.'gouraud'— Calculate the light at the vertices, and then linearly interpolate across the edges.
Note
The 'phong' value has been removed. Use 'gouraud' instead.
Markers
Marker symbol, specified as one of the values listed in this table. By default, the object does not display markers. Specifying a marker symbol adds markers at each data point or vertex.
| Marker | Description | Resulting Marker |
|---|---|---|
| "o" | Circle |  |
| "+" | Plus sign |  |
| "*" | Asterisk |  |
| "." | Point |  |
| "x" | Cross |  |
| "_" | Horizontal line |  |
| "|" | Vertical line |  |
| "square" | Square |  |
| "diamond" | Diamond |  |
| "^" | Upward-pointing triangle |  |
| "v" | Downward-pointing triangle |  |
| ">" | Right-pointing triangle |  |
| "<" | Left-pointing triangle |  |
| "pentagram" | Pentagram |  |
| "hexagram" | Hexagram |  |
| "none" | No markers | Not applicable |
Marker size, specified as a positive value in points, where 1 point = 1/72 of an inch.
Marker outline color, specified as 'auto', 'flat', an RGB triplet, a hexadecimal color code, a color name, or a short name. The'auto' option uses the same color as theEdgeColor property. The 'flat' option uses the CData value at the vertex to set the color.
For a custom color, specify an RGB triplet or a hexadecimal color code.
- An RGB triplet is a three-element row vector whose elements specify the intensities of the red, green, and blue components of the color. The intensities must be in the range
[0,1], for example,[0.4 0.6 0.7]. - A hexadecimal color code is a string scalar or character vector that starts with a hash symbol (
#) followed by three or six hexadecimal digits, which can range from0toF. The values are not case sensitive. Therefore, the color codes"#FF8800","#ff8800","#F80", and"#f80"are equivalent.
Alternatively, you can specify some common colors by name. This table lists the named color options, the equivalent RGB triplets, and hexadecimal color codes.
| Color Name | Short Name | RGB Triplet | Hexadecimal Color Code | Appearance |
|---|---|---|---|---|
| "red" | "r" | [1 0 0] | "#FF0000" | |
| "green" | "g" | [0 1 0] | "#00FF00" | |
| "blue" | "b" | [0 0 1] | "#0000FF" | |
| "cyan" | "c" | [0 1 1] | "#00FFFF" | |
| "magenta" | "m" | [1 0 1] | "#FF00FF" | |
| "yellow" | "y" | [1 1 0] | "#FFFF00" | |
| "black" | "k" | [0 0 0] | "#000000" | |
| "white" | "w" | [1 1 1] | "#FFFFFF" | |
| "none" | Not applicable | Not applicable | Not applicable | No color |
Here are the RGB triplets and hexadecimal color codes for the default colors MATLAB uses in many types of plots.
| RGB Triplet | Hexadecimal Color Code | Appearance |
|---|---|---|
| [0 0.4470 0.7410] | "#0072BD" | |
| [0.8500 0.3250 0.0980] | "#D95319" | |
| [0.9290 0.6940 0.1250] | "#EDB120" | |
| [0.4940 0.1840 0.5560] | "#7E2F8E" | |
| [0.4660 0.6740 0.1880] | "#77AC30" | |
| [0.3010 0.7450 0.9330] | "#4DBEEE" | |
| [0.6350 0.0780 0.1840] | "#A2142F" | |
Marker fill color, specified as 'auto', 'flat', an RGB triplet, a hexadecimal color code, a color name, or a short name. The'auto' option uses the same color as the Color property for the axes. The'flat' option uses the CData value of the vertex to set the color.
For a custom color, specify an RGB triplet or a hexadecimal color code.
- An RGB triplet is a three-element row vector whose elements specify the intensities of the red, green, and blue components of the color. The intensities must be in the range
[0,1], for example,[0.4 0.6 0.7]. - A hexadecimal color code is a string scalar or character vector that starts with a hash symbol (
#) followed by three or six hexadecimal digits, which can range from0toF. The values are not case sensitive. Therefore, the color codes"#FF8800","#ff8800","#F80", and"#f80"are equivalent.
Alternatively, you can specify some common colors by name. This table lists the named color options, the equivalent RGB triplets, and hexadecimal color codes.
| Color Name | Short Name | RGB Triplet | Hexadecimal Color Code | Appearance |
|---|---|---|---|---|
| "red" | "r" | [1 0 0] | "#FF0000" | |
| "green" | "g" | [0 1 0] | "#00FF00" | |
| "blue" | "b" | [0 0 1] | "#0000FF" | |
| "cyan" | "c" | [0 1 1] | "#00FFFF" | |
| "magenta" | "m" | [1 0 1] | "#FF00FF" | |
| "yellow" | "y" | [1 1 0] | "#FFFF00" | |
| "black" | "k" | [0 0 0] | "#000000" | |
| "white" | "w" | [1 1 1] | "#FFFFFF" | |
| "none" | Not applicable | Not applicable | Not applicable | No color |
Here are the RGB triplets and hexadecimal color codes for the default colors MATLAB uses in many types of plots.
| RGB Triplet | Hexadecimal Color Code | Appearance |
|---|---|---|
| [0 0.4470 0.7410] | "#0072BD" | |
| [0.8500 0.3250 0.0980] | "#D95319" | |
| [0.9290 0.6940 0.1250] | "#EDB120" | |
| [0.4940 0.1840 0.5560] | "#7E2F8E" | |
| [0.4660 0.6740 0.1880] | "#77AC30" | |
| [0.3010 0.7450 0.9330] | "#4DBEEE" | |
| [0.6350 0.0780 0.1840] | "#A2142F" | |
This property affects only the circle, square, diamond, pentagram, hexagram, and the four triangle marker types.
Example: [0.3 0.2 0.1]
Example: 'green'
Example: '#D2F9A7'
Coordinate Data
XData — _x_-coordinate data
vector or matrix
_x_-coordinate data specified as a matrix that is the same size as ZData or a vector oflength(n), where [m,n] = size(ZData).
Data Types: single | double | int8 | int16 | int32 | int64 | uint8 | uint16 | uint32 | uint64 | categorical | datetime | duration
XDataMode — Selection mode for XData
'auto' | 'manual'
Selection mode for XData, specified as one of these values:
'auto'— Use the column indices ofZData.'manual'— Use manually specified value. To specify the value, pass an input argument to the plotting function or directly set theXDataproperty.
YData — _y_-coordinate data
vector or matrix
_y_-coordinate data specified as a matrix that is the same size as ZData or a vector oflength(m), where [m,n] = size(ZData).
Data Types: single | double | int8 | int16 | int32 | int64 | uint8 | uint16 | uint32 | uint64 | categorical | datetime | duration
YDataMode — Selection mode for YData
'auto' | 'manual'
Selection mode for YData, specified as one of these values:
'auto'— Use the row indices ofZData.'manual'— Use manually specified value. To specify the value, pass an input argument to the plotting function or directly set theYDataproperty.
ZData — _z_-coordinate data
matrix
_z_-coordinate data specified as a matrix.
Data Types: single | double | int8 | int16 | int32 | int64 | uint8 | uint16 | uint32 | uint64 | categorical | datetime | duration
Color and Transparency Data
Vertex colors, specified in one of these forms:
- 2-D array — Use colormap colors. Specify a color for each vertex by setting
CDatato an array the same size asZData. TheCDataMappingproperty determines how these values map into the current colormap. If theFaceColorproperty is set to'texturemap', thenCDatadoes not need to be the same size asZData. However, it must be of typedoubleoruint8. TheCDatavalues map to conform to the surface defined byZData. - 3-D array — Use true colors. Specify an RGB triplet color for each vertex by setting
CDatato an m-by-n-by-3 array where[m,n] = size(ZData). An RGB triplet is a three-element vector that specifies the intensities of the red, green, and blue components of a color. The first page of the array contains the red components, the second the green components, and the third the blue components of the colors. Since the surface uses true colors instead of colormap colors, theCDataMappingproperty has no effect.- If
CDatais of typedoubleorsingle, then an RGB triplet value of[0 0 0]corresponds to black and[1 1 1]corresponds to white. - If
CDatais an integer type, then the surface uses the full range of data to determine the color. For example, ifCDatais of typeuint8, then[0 0 0]corresponds to black and[255 255 255]corresponds to white. IfCDatais of typeint8, then[-128 -128 -128]corresponds to black and[127 127 127]corresponds to white.
- If
Data Types: single | double | int8 | int16 | int32 | int64 | uint8 | uint16 | uint32 | uint64
Selection mode for CData, specified as one of these values:
'auto'— Use theZDatavalues to set the colors.'manual'— Use manually specified values. To specify the values, set theCDataproperty.
CDataMapping — Direct or scaled colormapping
'scaled' (default) | 'direct'
Direct or scaled colormapping, specified as one of these values:
scaled— Transform the color data to span the portion of the colormap indicated by the axesCLimproperty, linearly mapping data values to colors.direct— Use the color data as indices directly into the colormap. The color data should then be integer values ranging from 1 tolength(colormap). MATLAB maps values less than 1 to the first color in the colormap, and values greater thanlength(colormap)to the last color in the colormap. Values with a decimal portion are fixed to the nearest lower integer.
Transparency data for each vertex, specified as an array the same size as the ZData property. After specifying the values, set the FaceAlpha and EdgeAlpha properties to control the type of transparency. If the FaceAlpha and EdgeAlpha properties are both set to scalar values, then the surface does not use the AlphaData values.
The AlphaDataMapping property determines how the surface interprets the AlphaData property values.
Data Types: single | double | int8 | int16 | int32 | int64 | uint8 | uint16 | uint32 | uint64 | logical
Interpretation of AlphaData values, specified as one of these values:
'none'— Interpret the values as transparency values. A value of 1 or greater is completely opaque, a value of 0 or less is completely transparent, and a value between 0 and 1 is semitransparent.'scaled'— Map the values into the figure’s alphamap. The minimum and maximum alpha limits of the axes determine theAlphaDatavalues that map to the first and last elements in the alphamap, respectively. For example, if the alpha limits are[3 5], then values of3or less map to the first element in the alphamap. Values of5or greater map to the last element in the alphamap. The ALim property of the axes contains the alpha limits. The Alphamap property of the figure contains the alphamap.'direct'— Interpret the values as indices into the figure’s alphamap. Values with a decimal portion are fixed to the nearest lower integer.- If the values are of type
doubleorsingle, then values of 1 or less map to the first element in the alphamap. Values equal to or greater than the length of the alphamap map to the last element in the alphamap. - If the values are of integer type, then values of 0 or less map to the first element in the alphamap. Values equal to or greater than the length of the alphamap map to the last element in the alphamap (or up to maximum value for the integer type). The integer types are
uint8,uint16,uint32,uint64,int8,int16,int32, andint64. - If the values are of type
logical, then values of 0 map to the first element in the alphamap and values of 1 map to the second element in the alphamap.
- If the values are of type
Normals
Normal vectors for each surface vertex, specified as a m-by-n-by-3 array, where [m,n] = size(ZData). Specify one normal vector per vertex.
Specifying values for this property sets the associated mode to manual. If you do not specify normal vectors, then the surface generates this data for lighting calculations.
Data Types: single | double
Selection mode for VertexNormals, specified as one of these values:
'auto'— Calculate the normal vectors based on the coordinate data.'manual'— Use manually specified values. To specify the values, set theVertexNormalsproperty.
Normal vectors for each surface face, specified as a (m-1)-by-(n-1)-by-3 array, where [m,n] = size(ZData). Specify one normal vector per face.
Specifying values for this property sets the associated mode to manual. If you do not specify normal vectors, then the surface generates this data for lighting calculations.
Data Types: single | double
Selection mode for FaceNormals, specified as one of these values:
'auto'— Calculate the normal vectors based on the coordinate data.'manual'— Use manually specified values. To specify the values, set theFaceNormalsproperty.
Lighting
Strength of ambient light, specified as a scalar value in the range [0,1]. Ambient light is a nondirectional light that illuminates the entire scene. There must be at least one visible light object in the axes for the ambient light to be visible.
The AmbientLightColor property for the axes sets the color of the ambient light. The color is the same for all objects in the axes.
Example: 0.5
Data Types: double
Strength of diffuse light, specified as a scalar value in the range [0,1]. Diffuse light is the nonspecular reflectance from light objects in the axes.
Example: 0.3
Data Types: double
Strength of specular reflection, specified as a scalar value in the range [0,1]. Specular reflections are the bright spots on the surface from light objects in the axes.
Example: 0.3
Data Types: double
Size of specular spot, specified as a scalar value greater than or equal to 1. Most materials have exponents in the range [5 20].
Example: 7
Data Types: double
Color of specular reflections, specified as a scalar value in the range [0,1]. A value of 1 sets the color using only the color of the light source. A value of 0 sets the color using both the color of the object from which it reflects and the color of the light source. The Color property of the light contains the color of the light source. The proportions vary linearly for values in between.
Example: 0.5
Data Types: double
Legend
Legend label, specified as a character vector or string scalar. The legend does not display until you call the legend command. If you do not specify the text, then legend sets the label using the form'dataN'.
Include the object in the legend, specified as an Annotation object. Set the underlying IconDisplayStyle property of theAnnotation object to one of these values:
"on"— Include the object in the legend (default)."off"— Do not include the object in the legend.
For example, to exclude the Surface object namedobj from the legend, set the IconDisplayStyle property to "off".
obj.Annotation.LegendInformation.IconDisplayStyle = "off";
Alternatively, you can control the items in a legend using the legend function. Specify the first input argument as a vector of the graphics objects to include. If you do not specify an existing graphics object in the first input argument, then it does not appear in the legend. However, graphics objects added to the axes after the legend is created do appear in the legend. Consider creating the legend after creating all the plots to avoid extra items.
Interactivity
State of visibility, specified as "on" or "off", or as numeric or logical 1 (true) or0 (false). A value of "on" is equivalent to true, and "off" is equivalent tofalse. Thus, you can use the value of this property as a logical value. The value is stored as an on/off logical value of type matlab.lang.OnOffSwitchState.
"on"— Display the object."off"— Hide the object without deleting it. You still can access the properties of an invisible object.
DataTipTemplate — Data tip content
DataTipTemplate object
Data tip content, specified as a DataTipTemplate object. You can control the content that appears in a data tip by modifying the properties of the underlying DataTipTemplate object. For a list of properties, see DataTipTemplate Properties.
For an example of modifying data tips, see Create Custom Data Tips.
This property applies only to surfaces with pinned data tips.
Note
The DataTipTemplate object is not returned byfindobj or findall, and it is not copied by copyobj.
Context menu, specified as a ContextMenu object. Use this property to display a context menu when you right-click the object. Create the context menu using the uicontextmenu function.
Note
If the PickableParts property is set to'none' or if the HitTest property is set to 'off', then the context menu does not appear.
Selection state, specified as 'on' or 'off', or as numeric or logical 1 (true) or0 (false). A value of 'on' is equivalent to true, and 'off' is equivalent tofalse. Thus, you can use the value of this property as a logical value. The value is stored as an on/off logical value of type matlab.lang.OnOffSwitchState.
'on'— Selected. If you click the object when in plot edit mode, then MATLAB sets itsSelectedproperty to'on'. If theSelectionHighlightproperty also is set to'on', then MATLAB displays selection handles around the object.'off'— Not selected.
Display of selection handles when selected, specified as 'on' or'off', or as numeric or logical 1 (true) or 0 (false). A value of 'on' is equivalent to true, and 'off' is equivalent to false. Thus, you can use the value of this property as a logical value. The value is stored as an on/off logical value of type matlab.lang.OnOffSwitchState.
'on'— Display selection handles when theSelectedproperty is set to'on'.'off'— Never display selection handles, even when theSelectedproperty is set to'on'.
Clipping of the object to the axes limits, specified as 'on' or'off', or as numeric or logical 1 (true) or 0 (false). A value of 'on' is equivalent to true, and 'off' is equivalent to false. Thus, you can use the value of this property as a logical value. The value is stored as an on/off logical value of type matlab.lang.OnOffSwitchState.
- A value of
'on'clips parts of the object that are outside the axes limits. - A value of
'off'displays the entire object, even if parts of it appear outside the axes limits. Parts of the object might appear outside the axes limits if you create a plot, sethold on, freeze the axis scaling, and then create the object so that it is larger than the original plot.
The Clipping property of the axes that contains the object must be set to'on'. Otherwise, this property has no effect. For more information about the clipping behavior, see the Clipping property of the axes.
Callbacks
Mouse-click callback, specified as one of these values:
- Function handle
- Cell array containing a function handle and additional arguments
- Character vector that is a valid MATLAB command or function, which is evaluated in the base workspace (not recommended)
Use this property to execute code when you click the object. If you specify this property using a function handle, then MATLAB passes two arguments to the callback function when executing the callback:
- Clicked object — Access properties of the clicked object from within the callback function.
- Event data — Empty argument. Replace it with the tilde character (
~) in the function definition to indicate that this argument is not used.
For more information on how to use function handles to define callback functions, see Create Callbacks for Graphics Objects.
Note
If the PickableParts property is set to 'none' or if the HitTest property is set to 'off', then this callback does not execute.
Object creation function, specified as one of these values:
- Function handle.
- Cell array in which the first element is a function handle. Subsequent elements in the cell array are the arguments to pass to the callback function.
- Character vector containing a valid MATLAB expression (not recommended). MATLAB evaluates this expression in the base workspace.
For more information about specifying a callback as a function handle, cell array, or character vector, see Create Callbacks for Graphics Objects.
This property specifies a callback function to execute when MATLAB creates the object. MATLAB initializes all property values before executing the CreateFcn callback. If you do not specify the CreateFcn property, then MATLAB executes a default creation function.
Setting the CreateFcn property on an existing component has no effect.
If you specify this property as a function handle or cell array, you can access the object that is being created using the first argument of the callback function. Otherwise, use the gcbo function to access the object.
Object deletion function, specified as one of these values:
- Function handle.
- Cell array in which the first element is a function handle. Subsequent elements in the cell array are the arguments to pass to the callback function.
- Character vector containing a valid MATLAB expression (not recommended). MATLAB evaluates this expression in the base workspace.
For more information about specifying a callback as a function handle, cell array, or character vector, see Create Callbacks for Graphics Objects.
This property specifies a callback function to execute when MATLAB deletes the object. MATLAB executes the DeleteFcn callback before destroying the properties of the object. If you do not specify the DeleteFcn property, then MATLAB executes a default deletion function.
If you specify this property as a function handle or cell array, you can access the object that is being deleted using the first argument of the callback function. Otherwise, use the gcbo function to access the object.
Callback Execution Control
Callback interruption, specified as 'on' or 'off', or as numeric or logical 1 (true) or0 (false). A value of 'on' is equivalent to true, and 'off' is equivalent tofalse. Thus, you can use the value of this property as a logical value. The value is stored as an on/off logical value of type matlab.lang.OnOffSwitchState.
This property determines if a running callback can be interrupted. There are two callback states to consider:
- The running callback is the currently executing callback.
- The interrupting callback is a callback that tries to interrupt the running callback.
MATLAB determines callback interruption behavior whenever it executes a command that processes the callback queue. These commands include drawnow, figure, uifigure, getframe, waitfor, and pause.
If the running callback does not contain one of these commands, then no interruption occurs. MATLAB first finishes executing the running callback, and later executes the interrupting callback.
If the running callback does contain one of these commands, then theInterruptible property of the object that owns the running callback determines if the interruption occurs:
- If the value of
Interruptibleis'off', then no interruption occurs. Instead, theBusyActionproperty of the object that owns the interrupting callback determines if the interrupting callback is discarded or added to the callback queue. - If the value of
Interruptibleis'on', then the interruption occurs. The next time MATLAB processes the callback queue, it stops the execution of the running callback and executes the interrupting callback. After the interrupting callback completes, MATLAB then resumes executing the running callback.
Note
Callback interruption and execution behave differently in these situations:
- If the interrupting callback is a
DeleteFcn,CloseRequestFcn, orSizeChangedFcncallback, then the interruption occurs regardless of theInterruptibleproperty value. - If the running callback is currently executing the
waitforfunction, then the interruption occurs regardless of theInterruptibleproperty value. - If the interrupting callback is owned by a
Timerobject, then the callback executes according to schedule regardless of theInterruptibleproperty value.
Note
When an interruption occurs, MATLAB does not save the state of properties or the display. For example, the object returned by the gca or gcf command might change when another callback executes.
Callback queuing, specified as 'queue' or 'cancel'. The BusyAction property determines how MATLAB handles the execution of interrupting callbacks. There are two callback states to consider:
- The running callback is the currently executing callback.
- The interrupting callback is a callback that tries to interrupt the running callback.
The BusyAction property determines callback queuing behavior only when both of these conditions are met:
- The running callback contains a command that processes the callback queue, such as drawnow, figure, uifigure, getframe, waitfor, or pause.
- The value of the
Interruptibleproperty of the object that owns the running callback is'off'.
Under these conditions, the BusyAction property of the object that owns the interrupting callback determines how MATLAB handles the interrupting callback. These are possible values of theBusyAction property:
'queue'— Puts the interrupting callback in a queue to be processed after the running callback finishes execution.'cancel'— Does not execute the interrupting callback.
Ability to capture mouse clicks, specified as one of these values:
'visible'— Capture mouse clicks when visible. TheVisibleproperty must be set to'on'and you must click a part of theSurfaceobject that has a defined color. You cannot click a part that has an associated color property set to'none'. If the plot contains markers, then the entire marker is clickable if either the edge or the fill has a defined color. TheHitTestproperty determines if theSurfaceobject responds to the click or if an ancestor does.'all'— Capture mouse clicks regardless of visibility. TheVisibleproperty can be set to'on'or'off'and you can click a part of theSurfaceobject that has no color. TheHitTestproperty determines if theSurfaceobject responds to the click or if an ancestor does.'none'— Cannot capture mouse clicks. Clicking theSurfaceobject passes the click through it to the object below it in the current view of the figure window. TheHitTestproperty has no effect.
Response to captured mouse clicks, specified as 'on' or'off', or as numeric or logical 1 (true) or 0 (false). A value of 'on' is equivalent to true, and 'off' is equivalent to false. Thus, you can use the value of this property as a logical value. The value is stored as an on/off logical value of type matlab.lang.OnOffSwitchState.
'on'— Trigger theButtonDownFcncallback of theSurfaceobject. If you have defined theContextMenuproperty, then invoke the context menu.'off'— Trigger the callbacks for the nearest ancestor of theSurfaceobject that meets one of these conditions:HitTestproperty is set to'on'.PickablePartsproperty is set to a value that enables the ancestor to capture mouse clicks.
Note
The PickableParts property determines if the Surface object can capture mouse clicks. If it cannot, then the HitTest property has no effect.
This property is read-only.
Deletion status, returned as an on/off logical value of type matlab.lang.OnOffSwitchState.
MATLAB sets the BeingDeleted property to'on' when the DeleteFcn callback begins execution. The BeingDeleted property remains set to'on' until the component object no longer exists.
Check the value of the BeingDeleted property to verify that the object is not about to be deleted before querying or modifying it.
Parent/Child
Parent, specified as an Axes, Group, or Transform object.
Children, returned as an empty GraphicsPlaceholder array or aDataTip object array. Use this property to view a list of data tips that are plotted on the chart.
You cannot add or remove children using the Children property. To add a child to this list, set the Parent property of theDataTip object to the chart object.
Visibility of the object handle in the Children property of the parent, specified as one of these values:
"on"— Object handle is always visible."off"— Object handle is invisible at all times. This option is useful for preventing unintended changes by another function. SetHandleVisibilityto"off"to temporarily hide the handle during the execution of that function."callback"— Object handle is visible from within callbacks or functions invoked by callbacks, but not from within functions invoked from the command line. This option blocks access to the object at the command line, but permits callback functions to access it.
If the object is not listed in the Children property of the parent, then functions that obtain object handles by searching the object hierarchy or querying handle properties cannot return it. Examples of such functions include theget, findobj, gca, gcf, gco, newplot, cla, clf, and close functions.
Hidden object handles are still valid. Set the root ShowHiddenHandles property to "on" to list all object handles regardless of theirHandleVisibility property setting.
Identifiers
Type — Type of graphics object
'surface'
This property is read-only.
Type of graphics object, returned as 'surface'
Object identifier, specified as a character vector or string scalar. You can specify a unique Tag value to serve as an identifier for an object. When you need access to the object elsewhere in your code, you can use the findobj function to search for the object based on the Tag value.
User data, specified as any MATLAB array. For example, you can specify a scalar, vector, matrix, cell array, character array, table, or structure. Use this property to store arbitrary data on an object.
If you are working in App Designer, create public or private properties in the app to share data instead of using the UserData property. For more information, see Share Data Within App Designer Apps.
Version History
Introduced before R2006a
R2020a: UIContextMenu property is not recommended
Setting or getting UIContextMenu property is not recommended. Instead, use the ContextMenu property, which accepts the same type of input and behaves the same way as theUIContextMenu property.
There are no plans to remove the UIContextMenu property, but it is no longer listed when you call the set, get, orproperties functions on the Surface object.