TiledChartLayout - Tiled chart layout appearance and behavior - MATLAB (original) (raw)
TiledChartLayout Properties
Tiled chart layout appearance and behavior
A tiled chart layout is a container for displaying a tiling of plots in a figure. Each tile can contain an axes object for displaying a plot. By changing property values, you can modify certain aspects of the layout.
t = tiledlayout(2,2); t.TileSpacing = 'compact';
GridSize — Grid size
vector of the form [m n]
Grid size, specified as a vector of the form [m n], wherem is the number of rows and n is the number of columns. You can set this property only when all the tiles in the layout are empty. When you set this property, MATLAB® sets the TileArrangement property to'fixed'.
The value of this property might change automatically for layouts that have theTileArrangement property set to 'flow'. For example, if the parent container resizes or the number of axes in the layout changes, the grid size updates to accommodate those changes.
TileArrangement — Tile arrangement
"fixed" | "flow" | "vertical" | "horizontal"
This property is read-only.
Tile arrangement, returned as one of these values:
"fixed"— The layout is a grid with a fixed number of rows and columns as determined by theGridSizeproperty. Anm-by-nlayout with this tile arrangement can display up tom*nplots."flow"— The layout is a grid with a variable number of rows and columns. Each time you callnexttile, the layout reflows as needed to accommodate the new axes while maintaining an aspect ratio of roughly 4:3 for all the tiles."vertical"— The layout holds a vertical stack of axes. Each time you callnexttile, a new axes object is added to the bottom of the stack. (since R2023a)"horizontal"— The layout holds a horizontal stack of axes. Each time you callnexttile, a new axes object is added to the right side of the stack. (since R2023a)
MATLAB sets the value of this property to "fixed" if you manually set the GridSize property.
To set the tile arrangement, specify the arrangement argument when you call the tiledlayout function.
TileSpacing — Tile spacing
"loose" (default) | "compact" | "tight" | "none"
Tile spacing, specified as "loose", "compact","tight" or "none". Use this property to control the spacing between the tiles.
This table shows how each value affects the appearance of a 2-by-2 layout.
| Value | Appearance |
|---|---|
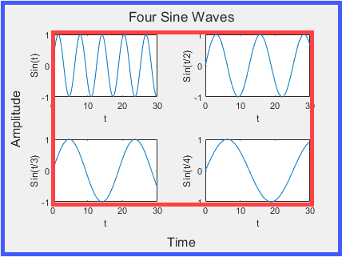
| "loose" | 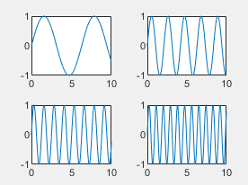 |
| "compact" | 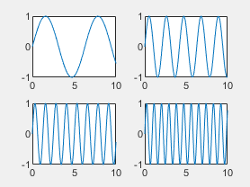 |
| "tight" | 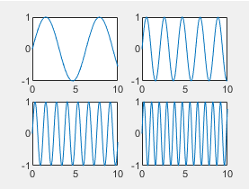 |
| "none" | 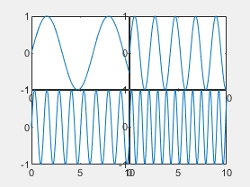 |
Padding — Padding around layout
"loose" (default) | "compact" | "tight"
Padding around the perimeter of the layout, specified as "loose","compact", or "tight". The layout provides space for all decorations, such as axis labels, regardless of the value of this property.
This table shows how each value affects the appearance of a 2-by-2 layout.
| Value | Appearance |
|---|---|
| "loose" | |
| "compact" | 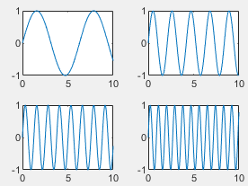 |
| "tight" | 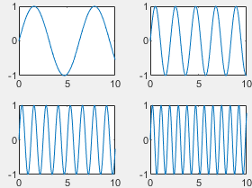 |
TileIndexing — Tile indexing scheme
'rowmajor' (default) | 'columnmajor'
Tile indexing scheme, specified as a value from the table. Thenexttile function populates tiles according to this indexing scheme. If you change the tile indexing scheme of a populated layout, the tile positions change to match the new scheme. The indexing scheme also affects which axes object MATLAB returns when you call nexttile to get the axes object in a specific tile.
| Value | Description |
|---|---|
| 'rowmajor' | The tile numbers increase across the rows, from left to right. For example, this picture shows the row major tile indices for a 2-by-2 layout. 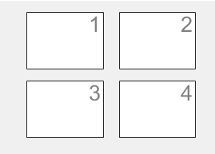 |
| 'columnmajor' | The tile numbers increase down the columns. For example, this picture shows the column major tile indices for a 2-by-2 layout. 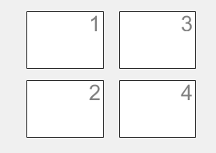 |
Labels
Title — Text object for shared title
Text object
Text object for a shared title. To add a shared title, set theString property of the Text object. To change the title appearance, such as the font style or color, set other properties. For example, create a shared title for a 2-by-2 layout that has a bold font weight.
t = tiledlayout(2,2); t.Title.String = 'My Title'; t.Title.FontWeight = 'bold';
Alternatively, pass the TiledChartLayout object to the title function.
title(t,'My Title','FontWeight','normal')
For a complete list of properties that you can specify, see Text Properties.
Note
The Text object is not contained in theChildren property of the layout, so it cannot be returned by thefindobj function.
Subtitle — Text object for shared subtitle
text object
Text object for the shared subtitle. To add a subtitle, set theString property of the text object. To change its appearance, such as the font angle, set other properties. For a complete list, see Text Properties.
t = tiledlayout(2,2); t.Subtitle.String = 'An Insightful Subtitle'; t.Subtitle.FontAngle = 'italic';
Alternatively, the subtitle function to add a subtitle and control the appearance.
subtitle('An Insightful Subtitle','FontAngle','italic')
Or use the title function, and specify two character vector input arguments and two output arguments. Then set properties on the second text object returned by the function.
[tt,s] = title(t,'Clever Title','An Insightful Subtitle'); s.FontAngle = 'italic';
Note
This text object is not contained in the axes Children property, cannot be returned by findobj, and does not use default values defined for text objects.
XLabel — Text object for shared _x_-axis label
Text object
Text object for a shared _x_-axis label. To add a shared _x_-axis label, set the String property of the text object. To change the label appearance, such as the font size, set other properties. For example, create a shared _x_-axis label with a 14-point font for a 2-by-2 layout.
t = tiledlayout(2,2); t.XLabel.String = 'My x-Axis Label'; t.XLabel.FontSize = 14;
Alternatively, pass the TiledChartLayout object to the xlabel function.
xlabel(t,'My x-Axis Label','FontSize',14)
For a complete list of properties you can specify, see Text Properties.
Note
The Text object is not contained in the axesChildren property, so it cannot be returned by findobj.
YLabel — Text object for shared _y_-axis label
Text object
Text object for a shared _y_-axis label. To add a shared _y_-axis label, set the String property of the text object. To change the label appearance, such as the font size, set other properties. For example, create a shared _y_-axis label with a 14-point font for a 2-by-2 layout.
t = tiledlayout(2,2); t.YLabel.String = 'My y-Axis Label'; t.YLabel.FontSize = 14;
Alternatively, pass the TiledChartLayout object to the ylabel function.
ylabel(t,'My y-Axis Label','FontSize',14)
For a complete list of properties you can specify, see Text Properties.
Note
The Text object is not contained in the axesChildren property, so it cannot be returned by findobj.
Position
OuterPosition — Outer size and location
[0 0 1 1] (default) | four-element vector
Outer size and location, including the margins for decorations such titles and axis labels, specified as a four-element vector of the form [left bottom width height]. The values in the vector are in the units specified by theUnits property. The default value of [0 0 1 1] includes the whole interior of the container.
- The
leftandbottomelements define the distance from the lower left corner of the container (typically a figure, panel, or tab) to the lower left corner of the outer position boundary. - The
widthandheightelements are the outer position boundary dimensions.
In the following layout, the blue rectangle represents theOuterPosition property, and the red rectangle represents theInnerPosition and Position properties (which have the same value).
Note
Setting this property has no effect when the parent container is aTiledChartLayout object.
InnerPosition — Inner size and location
[0.1300 0.1100 0.7750 0.8150] (default) | four-element vector
Inner size and location, excluding the margins for decorations such titles and axis labels, specified as a four-element vector of the form [left bottom width height]. This property is equivalent to the Position property.
Note
Setting this property has no effect when the parent container is aTiledChartLayout object.
Position — Inner size and location
[0.1300 0.1100 0.7750 0.8150] (default) | four-element vector
Inner size and location, excluding the margins for decorations such titles and axis labels, specified as a four-element vector of the form [left bottom width height]. The values in the vector are in the units specified by theUnits property.
- The
leftandbottomelements define the distance from the lower left corner of the container (typically a figure, panel, or tab) to the lower left corner of the position boundary. - The
widthandheightelements are the position boundary dimensions. For axes in a 3-D view, thePositionproperty is the smallest rectangle that encloses the axes.
In the following layout, the blue rectangle represents theOuterPosition property, and the red rectangle represents theInnerPosition and Position properties (which have the same value).
Note
Setting this property has no effect when the parent container is aTiledChartLayout object.
PositionConstraint — Position to hold constant
"outerposition" | "innerposition"
Position property to hold constant when adding, removing, or changing decorations, specified as one of the following values:
"outerposition"— TheOuterPositionproperty remains constant when you add, remove, or change decorations such as a title or an axis label. If any positional adjustments are needed, MATLAB adjusts theInnerPositionproperty."innerposition"— TheInnerPositionproperty remains constant when you add, remove, or change decorations such as a title or an axis label. If any positional adjustments are needed, MATLAB adjusts theOuterPositionproperty.
Note
Setting this property has no effect when the parent container is aTiledChartLayout object.
Position units, specified as one of the values in this table.
| Units | Description |
|---|---|
| 'normalized' (default) | Normalized with respect to the parent container, which is usually the figure. The lower left corner of the figure maps to (0,0) and the upper right corner maps to (1,1). |
| 'inches' | Inches. |
| 'centimeters' | Centimeters. |
| 'characters' | Based on the default system font character size. Character width = width of letterx.Character height = distance between the baselines of two lines of text. |
| 'points' | Points. One point equals 1/72 inch. |
| 'pixels' | Pixels. On Windows® systems, a pixel is 1/96th of an inch.On Macintosh systems, a pixel is 1/72nd of an inch.On Linux® systems, the size of a pixel is determined by your system resolution. |
All units are measured from the lower-left corner of the parent container.
This property affects other properties, such as the Position property. If you change the units, then return the units to the default value after completing your computation to prevent affecting other functions that assume the default value.
If you specify the Position and Units properties asName,Value pairs when creating the object, then the order of specification matters. For example, to set the position in specific units, then you must set the Units property before the Position property.
Layout — Layout options
empty LayoutOptions array (default) | TiledChartLayoutOptions object
Layout options, specified as a TiledChartLayoutOptions object. Use this property to position a nested layout within its parent layout. For instance, to position a layout within another tiled chart layout, set the Tile and TileSpan properties on theTiledChartLayoutOptions object.
For example, this code positions layout2 into the third tile oflayout1.
layout1 = tiledlayout(2,2); layout2 = tiledlayout(layout1,1,3); layout2.Layout.Tile = 3;
To make the nested layout span multiple tiles, specify theTileSpan property as a two-element vector. For example, this code spans layout2 across one row and two columns of tiles.
layout2.Layout.TileSpan = [1 2];
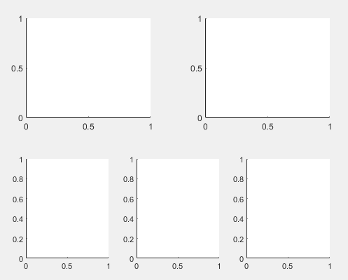
If you fill all the tiles in both layouts, the composite layout looks like this:
If the layout is not a child of another layout (for example, if it is a child of a figure or panel), then this property is empty and has no effect.
Interactivity
Toolbar — Shared data exploration toolbar
empty GraphicPlaceholder array (default) | AxesToolbar object
Shared data exploration toolbar, specified as an AxesToolbar object returned by the axtoolbar function. The toolbar appears in the top-right corner of the layout when you hover over it.
By default, there is no shared toolbar, and each of the individual axes objects has its own toolbar. When you create a shared toolbar, the toolbars on the individual axes objects become hidden. If you do not want any toolbars in the layout, leave this property empty and set the set the Visible property of theAxesToolbar object to 'off' for each axes.
t = tiledlayout(2,1); ax = nexttile; ax.Toolbar.Visible = 'off';
State of visibility, specified as "on" or "off", or as numeric or logical 1 (true) or0 (false). A value of "on" is equivalent to true, and "off" is equivalent tofalse. Thus, you can use the value of this property as a logical value. The value is stored as an on/off logical value of type matlab.lang.OnOffSwitchState.
"on"— Display the object."off"— Hide the object without deleting it. You still can access the properties of an invisible object.
Callbacks
GridSizeChangedFcn — Grid size changed callback
"" (default) | function handle | cell array | string scalar | character vector
Since R2022b
Grid size changed callback, specified as one of these values:
- A function handle.
- A cell array in which the first element is a function handle. Subsequent elements in the cell array are the arguments to pass to the callback function.
- A string scalar or character vector containing a valid MATLAB expression (not recommended for apps). MATLAB evaluates this expression in the base workspace.
Note that a layout with the TileArrangement property set to"fixed" cannot change the grid size unless the layout is empty. This callback executes after the GridSize property has changed. The grid size typically changes when the TileArrangement property is set to "flow", and then you add or remove tiles or resize the figure.
The GridSizeChangedFcn callback function can access specific information about the grid size. MATLAB passes this information in a GridSizeChanged object as the second argument to your callback function. If you are developing an app in App Designer, the argument is calledevent. You can query the object properties using dot notation. For example, event.NewGridSize returns the new grid size. The GridSizeChanged object is not available to callback functions specified as strings or character vectors.
This table lists the properties of the GridSizeChanged object.
| Property | Description |
|---|---|
| NewGridSize | Two-element vector containing the new grid size |
| OldGridSize | Two-element vector containing the previous grid size |
| Source | TiledChartLayout object that executes the callback |
| EventName | 'GridSizeChanged' |
For an example of a GridSizeChangedFcn callback, see Colorbar That Adjusts as Tiles Reflow. For more information about writing callbacks in apps, see Callbacks in App Designer.
Object creation function, specified as one of these values:
- Function handle.
- Cell array in which the first element is a function handle. Subsequent elements in the cell array are the arguments to pass to the callback function.
- Character vector containing a valid MATLAB expression (not recommended). MATLAB evaluates this expression in the base workspace.
For more information about specifying a callback as a function handle, cell array, or character vector, see Create Callbacks for Graphics Objects.
This property specifies a callback function to execute when MATLAB creates the object. MATLAB initializes all property values before executing the CreateFcn callback. If you do not specify the CreateFcn property, then MATLAB executes a default creation function.
Setting the CreateFcn property on an existing component has no effect.
If you specify this property as a function handle or cell array, you can access the object that is being created using the first argument of the callback function. Otherwise, use the gcbo function to access the object.
Object deletion function, specified as one of these values:
- Function handle.
- Cell array in which the first element is a function handle. Subsequent elements in the cell array are the arguments to pass to the callback function.
- Character vector containing a valid MATLAB expression (not recommended). MATLAB evaluates this expression in the base workspace.
For more information about specifying a callback as a function handle, cell array, or character vector, see Create Callbacks for Graphics Objects.
This property specifies a callback function to execute when MATLAB deletes the object. MATLAB executes the DeleteFcn callback before destroying the properties of the object. If you do not specify the DeleteFcn property, then MATLAB executes a default deletion function.
If you specify this property as a function handle or cell array, you can access the object that is being deleted using the first argument of the callback function. Otherwise, use the gcbo function to access the object.
Callback Execution Control
Callback interruption, specified as 'on' or 'off', or as numeric or logical 1 (true) or0 (false). A value of 'on' is equivalent to true, and 'off' is equivalent tofalse. Thus, you can use the value of this property as a logical value. The value is stored as an on/off logical value of type matlab.lang.OnOffSwitchState.
This property determines if a running callback can be interrupted. There are two callback states to consider:
- The running callback is the currently executing callback.
- The interrupting callback is a callback that tries to interrupt the running callback.
MATLAB determines callback interruption behavior whenever it executes a command that processes the callback queue. These commands include drawnow, figure, uifigure, getframe, waitfor, and pause.
If the running callback does not contain one of these commands, then no interruption occurs. MATLAB first finishes executing the running callback, and later executes the interrupting callback.
If the running callback does contain one of these commands, then theInterruptible property of the object that owns the running callback determines if the interruption occurs:
- If the value of
Interruptibleis'off', then no interruption occurs. Instead, theBusyActionproperty of the object that owns the interrupting callback determines if the interrupting callback is discarded or added to the callback queue. - If the value of
Interruptibleis'on', then the interruption occurs. The next time MATLAB processes the callback queue, it stops the execution of the running callback and executes the interrupting callback. After the interrupting callback completes, MATLAB then resumes executing the running callback.
Note
Callback interruption and execution behave differently in these situations:
- If the interrupting callback is a
DeleteFcn,CloseRequestFcn, orSizeChangedFcncallback, then the interruption occurs regardless of theInterruptibleproperty value. - If the running callback is currently executing the
waitforfunction, then the interruption occurs regardless of theInterruptibleproperty value. - If the interrupting callback is owned by a
Timerobject, then the callback executes according to schedule regardless of theInterruptibleproperty value.
Note
When an interruption occurs, MATLAB does not save the state of properties or the display. For example, the object returned by the gca or gcf command might change when another callback executes.
Callback queuing, specified as 'queue' or 'cancel'. The BusyAction property determines how MATLAB handles the execution of interrupting callbacks. There are two callback states to consider:
- The running callback is the currently executing callback.
- The interrupting callback is a callback that tries to interrupt the running callback.
The BusyAction property determines callback queuing behavior only when both of these conditions are met:
- The running callback contains a command that processes the callback queue, such as drawnow, figure, uifigure, getframe, waitfor, or pause.
- The value of the
Interruptibleproperty of the object that owns the running callback is'off'.
Under these conditions, the BusyAction property of the object that owns the interrupting callback determines how MATLAB handles the interrupting callback. These are possible values of theBusyAction property:
'queue'— Puts the interrupting callback in a queue to be processed after the running callback finishes execution.'cancel'— Does not execute the interrupting callback.
This property is read-only.
Deletion status, returned as an on/off logical value of type matlab.lang.OnOffSwitchState.
MATLAB sets the BeingDeleted property to'on' when the DeleteFcn callback begins execution. The BeingDeleted property remains set to'on' until the component object no longer exists.
Check the value of the BeingDeleted property to verify that the object is not about to be deleted before querying or modifying it.
Parent/Child
Parent — Parent container
Figure object | Panel object | Tab object | TiledChartLayout object
Parent container, specified as a Figure, Panel,Tab, or TiledChartLayout object.
Children, returned as an array of graphics objects. Use this property to view a list of the children or to reorder the children by setting the property to a permutation of itself.
You cannot add or remove children using the Children property. To add a child to this list, set the Parent property of the child graphics object to the TiledChartLayout object.
Visibility of the object handle in the Children property of the parent, specified as one of these values:
"on"— Object handle is always visible."off"— Object handle is invisible at all times. This option is useful for preventing unintended changes by another function. SetHandleVisibilityto"off"to temporarily hide the handle during the execution of that function."callback"— Object handle is visible from within callbacks or functions invoked by callbacks, but not from within functions invoked from the command line. This option blocks access to the object at the command line, but permits callback functions to access it.
If the object is not listed in the Children property of the parent, then functions that obtain object handles by searching the object hierarchy or querying handle properties cannot return it. Examples of such functions include theget, findobj, gca, gcf, gco, newplot, cla, clf, and close functions.
Hidden object handles are still valid. Set the root ShowHiddenHandles property to "on" to list all object handles regardless of theirHandleVisibility property setting.
Identifiers
Type — Type of graphics object
'tiledlayout'
This property is read-only.
Type of graphics object returned as 'tiledlayout'.
Object identifier, specified as a character vector or string scalar. You can specify a unique Tag value to serve as an identifier for an object. When you need access to the object elsewhere in your code, you can use the findobj function to search for the object based on the Tag value.
User data, specified as any MATLAB array. For example, you can specify a scalar, vector, matrix, cell array, character array, table, or structure. Use this property to store arbitrary data on an object.
If you are working in App Designer, create public or private properties in the app to share data instead of using the UserData property. For more information, see Share Data Within App Designer Apps.
Version History
Introduced in R2019b
R2023a: Query "vertical" and "horizontal" options for theTileArrangement property
When you query the TileArrangement property, two new possible values are "horizontal" and "vertical". A value of"horizontal" corresponds to a horizontal stack of tiles, and"vertical" corresponds to a vertical stack.
To set the tile arrangement, specify the arrangement argument when you call the tiledlayout function.
R2022b: Grid size changes can execute a GridSizeChangedFcn callback
Define the GridSizeChangedFcn callback function on a tiled chart layout. The callback function executes when the GridSize property of the layout changes. This callback is primarily useful for layouts that use the"flow" tile arrangement. For example, you can define a callback that displays the _x_-axis tick labels only in the bottom row of axes.
R2021a: Tile spacing and padding options have new names and behavior
When you create a tiled chart layout, some of the TileSpacing and Padding properties provide a different result or have new names.
The new TileSpacing options are "loose","compact", "tight", and "none". The new Padding options are "loose","compact", and "tight". The following tables describe how the previous options relate to the new options.
TileSpacing Changes
| Previous TileSpacing Option | R2021a TileSpacing Option | How to Update Your Code |
|---|---|---|
| "normal" |
"loose" |
Consider changing instances of "normal" to"loose".The"normal" option is no longer recommended, but it continues to work, and there are no plans to remove it. |
| "compact" |
"compact" |
No changes needed. |
| Not Applicable | "tight" |
"tight" is a new option. It provides the same result as"none" does in previous releases. |
| "none" |
"none" |
The "none" option removes all the space between adjacent plot boxes, and the tick labels overlap with neighboring plot boxes.To preserve the spacing between the plot boxes, change instances of "none" to"tight". |
Padding Changes
| Previous Padding Option | R2021a Padding Option | How to Update Your Code |
|---|---|---|
| "normal" |
"loose" |
Consider changing instances of "normal" to"loose".The"normal" option is no longer recommended, but it continues to work, and there are no plans to remove it. |
| "compact" |
"compact" |
No changes needed. |
| "none" |
"tight" |
Consider changing instances of "none" to"tight".The"none" option is no longer recommended, but it continues to work, and there are no plans to remove it. |