Genomic inflation factors under polygenic inheritance (original) (raw)
Introduction
Genome-wide association studies (GWAS) have led to the discovery of hundreds of genetic variants that are associated with complex diseases and traits.1 In total, however, the identified variants explain only a fraction of total risk or phenotypic variance, resulting in the so-called ‘missing heritability’.2, 3 One explanation is that most complex diseases and traits are caused by a large number of variants, the effects of which are too small to pass a stringent genome-wide significance level.3 Therefore, large sample sizes are required and many collaborations have been established to achieve this, resulting in published meta-analyses for a range of diseases and traits.4, 5, 6, 7, 8
One standard quality-control measure for GWAS and meta-analysis is genomic control (GC).9, 10, 11 The concept behind this method is that apart from a small number of SNPs that show a true association with the trait or disease, the test statistics for other SNPs should follow the distribution under the null hypothesis of no association between a SNP and the trait. However, artificial differences in allele frequencies due to population stratification, cryptic relatedness and genotyping errors will affect all SNPs and so the test statistics will be inflated across the whole genome.12, 13, 14 For instance, the mean and median _χ_2 value over all SNPs will be inflated by these artificial differences above their expectations under the null hypothesis of 1.0 and 0.455. This inflation can be detected and corrected for when testing for alleles that are associated with disease. The genomic control method was first proposed before GWAS, when it was hypothesised that the genetic architecture of complex traits was likely to consist of a small number of causal variants (in, eg, candidate genes) comprising a small proportion of the genome, and that a small number of non-associated null SNPs could be chosen to reflect most of the genome that was not associated with the trait. Before large-scale GWAS being conducted, this method was examined in the studies with hundreds of stratified individuals13, 15 and soon became a standard approach to quantify and adjust for population structure. In the first wave of GWAS, the genomic inflation factors observed in GWAS with thousands of individuals were usually <1.1, which were usually interpreted to be due to subtle population structure.16 Much larger inflation factors have been observed in GWAS with large sample size especially when pooling a number of GWAS into a meta-analysis.4, 5 For example, the GIANT meta-analysis of height observed a genomic inflation factor of 1.42 even after GC-correction in each of the participating studies.5
The logic of GC relies on the fact that only a small fraction of the SNPs show a true association with the disease. However, published results from GWAS clearly indicate that there are many causal variants for a particular disease or trait. We therefore addressed the question of what genomic inflation would be expected under polygenic inheritance. We used analytical derivations and simulation studies to quantify the expected mean (_λ_mean) and median (_λ_median) of a _χ_2-statistic for association from a GWAS under polygenic inheritance, in the absence of population structure and genotyping errors. We show that the predicted genomic inflation factors are consistent with those observed in practice.
Methods
Prediction of genomic inflation factors in quantitative trait and case–control association studies
In association analysis of a quantitative trait (QT), the non-centrality parameter (NCP) of _χ_2-statistic for a causal variant is

where N is the sample size and _q_2 is the proportion of phenotypic variance explained by a causal variant. Therefore, the NCP for a SNP that is in linkage disequilibrium (LD) with the causal variant is17, 18

where r is the correlation coefficient between the SNP and the causal variant due to LD.
Under the assumption that the causal variants have not been genotyped on the current commercial SNP arrays, the mean of _χ_2-statistics (_λ_mean) in GWAS is

where m is the number of causal variants, s j is the number of SNPs in LD with the _j-_th causal variant, n is the total number of SNPs, q _j_2 is the variance explained by the _j_-th causal variant and r _jk_2 is the LD _r_2 between the _j_-th causal variant and the _k_-th of the SNPs that are in LD with it.
Let _s_0 be the number of SNPs that are completely in linkage equilibrium with the causal variants so that their test statistics are distributed as _χ_12. In the absence of population structure or technical artefacts, the _χ_2-statistics of all the SNPs will be a mixture of _s_0 null SNPs and _n−s_0 non-null SNPs (distributed as non-central _χ_2) with a cumulative probability function of

where Φ(x, 1, θ) is the cumulative probability of non-central _χ_2-distribution with NCP of θ.
The median of _χ_2-statistics (_λ_median) is defined as _x_=c so that Q(c)=0.5. The genomic inflation factor with respect to the median of _χ_2-statistics is _λ_QTmedian=c/median(_χ_21)
For a case–control (CC) association study, we assume an underlying threshold-liability model of disease and a multiplicative model of genotype relative risk (GRR). If GRR is small, the variance explained on an underlying liability scale for a genetic variant is19

where p is the allele frequency of the variant, and _i_=z/K with K being the disease prevalence and z being the height of the standard normal curve at the truncating point pertaining to a probability of K.
Therefore, in a CC association study, the NCP for a causal variant is20

where v is the proportion of cases in the sample. Therefore, the NCP of a SNP in LD with the causal variant in a case–control study is

The mean of _χ_2-statistics from a genome-wide CC association study is

Analogous to that in the QT association study, the cumulative probability function of _χ_2-statistics in a case–control study is

and _λ_CCmedian=c/median(_χ_21) when P(c)=0.5.
Assume that the causal variants have a property that is similar to random SNPs in terms of allele frequency spectrum and LD structure. We randomly sampled m SNPs across the genome to mimic m causal variants. For each ‘causal variant’, we searched SNPs for LD within a d Mb region in either direction. Let y denote the genotype code for the causal variant and x for a SNP nearby. We tested for LD between the SNP and causal variant by simple regression, _y_=_b_0+b_1_x+e. We accepted a SNP in LD with the causal variant if the regression _P_-value <0.05. Obviously, there is a multiple-test problem, but it is unnecessary to correct for it because any SNP in significant LD with the causal variant will be inflated in single-SNP-based association tests.
For a QT, given the heritability (_h_2) and sample size, we sampled _q_2 for m causal variants from an exponential distribution with mean of _m/h_2 and weighted each _q_2 by _h_2/Σ_q_2 to constrain the sum of weighted _q_2 to be _h_2. Further, we predicted _λ_meanQT and _λ_medianQT by equations (3) and (4). For a CC study, given disease prevalence, _h_2 (heritability of liability on the underlying scale), sample size and number of cases, we predicted _λ_meanCC and _λ_meanCC by equations (8) and (9). When m becomes large, it is very likely that some SNPs will be in LD with multiple causal variants. In that case, we calculated _s_0 as the number of SNPs that were not in LD with the causal variants rather than by using the equation  because otherwise we will underestimate _s_0 and violate the definitions of equations (4) and (9), that is, Q(x → ∞) and P(x → ∞) would be >1. We then calculated the variance explained by a SNP in LD with s causal variants by
  where we summed r rather than _r_2 because the effects of two causal variants could be either in the same direction or opposite direction. We repeated the procedure 100 times and calculated the mean and SD of the predicted _λ_mean and _λ_median.
In the sections above, we showed how the genomic inflation factors can be predicted on the basis of the LD structure estimated from random SNPs and the heritability. When m is large (ie, _q_2 is small), equations (3) and (8) are approximately equal to


where s̄ is the average number of SNPs that are in LD with the causal variants (mimicked by a set of random SNPs) with average _r_2 of  . Since s̄ and
  are correlated, in practice, we use
  instead of
  .
.
Samples and genotyping
We selected 3925 unrelated individuals (3248 adults and 677 16-year olds) from several GWAS conducted at the Queensland Institute of Medical Research (QIMR).21 All the samples had measured or self-reported height and were genotyped on the Illumina 370K or 610K SNP arrays (Illumina Inc., San Diego, CA, USA). All the samples were collected with informed consent and appropriate ethical approval. A total of 294 831 autosomal SNPs were retained for analysis after stringent quality control. Principal component analysis of ancestry showed that all of these 3925 individuals are of European descent (see ref. 21 for details of the data and quality control procedures). The phenotypes were corrected for age and sex, and standardised to _z_-scores in the adult and adolescent cohorts separately.
Simulation schemes
We performed simulation studies based on the observed genotype data of 3925 individuals and ∼295K SNPs. We randomly sampled m SNPs as causal variants and generated the effect of each causal variant (b) from a standard normal distribution. We calculated the genetic value of each individual by  where x is coded as 0, 1 or 2 for genotype qq, Qq or QQ (allele is arbitrarily called Q or q), respectively. We generated residual effects (e) from N (0, var(g) (1−_h_2)/_h_2) and calculated the simulated phenotype by _y_=g+e.
For CC studies, we generated the disease liability in the same way as above. We ranked the individuals by liability and assigned the top 1000 individuals as cases and the remaining individuals as controls.
We used different settings of heritability (_h_2=0.2, 0.4 and 0.8) and number of causal variants (_m_=1, 10, 50, 100, 500 and 1000). For each setting, we repeated the simulation 100 times, randomising the positions of causal variants in each simulation replicate. We performed association analyses of the simulated data in PLINK22 and calculated mean and median of _χ_2-statistics with exclusion of the causal variants.
Results
Under the assumption of polygenic inheritance of a quantitative trait and disease liability, we derived analytical equations to predict the genomic inflation factor in GWAS for QT and CC study. We show that in the absence of population structure, the genomic inflation factor, either _λ_mean or _λ_median, is not expected to be unity, but is a function of sample size, LD structure, number of causal variants (m) and heritability (_h_2) for both QT and CC association studies. For the CC study, it depends further on disease prevalence and the proportion of cases in the sample. When _m_>10, _λ_mean is independent of the number of causal variants and depends only on the heritability, LD structure in the genome and the experimental sample size.
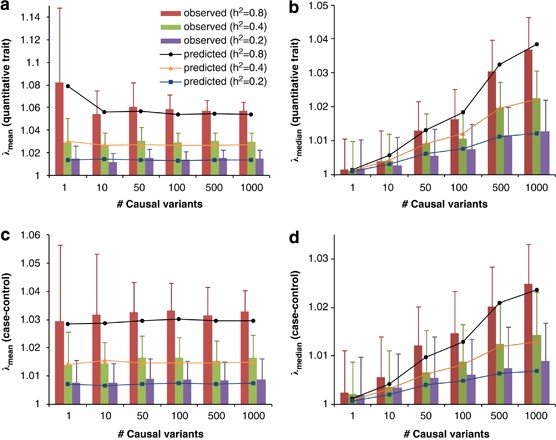
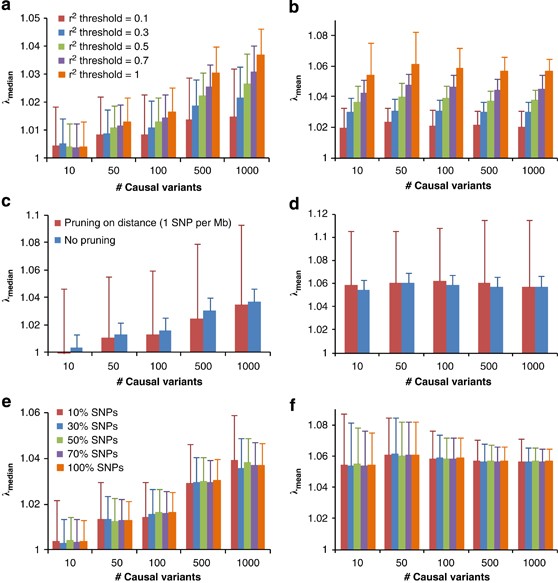
We demonstrate our method using a data set of 3925 unrelated individuals and 294 831 SNPs selected from several GWAS at the QIMR.21 We validated the analytical equations by simulations based on the actual genotype data. Results show that both _λ_mean and _λ_median increase with _h_2 (Figure 1), decrease when pruning SNPs for LD, but do not change when selecting SNPs at random or based on physical distance (Figure 2). Conditional on _h_2, _λ_mean is approximately constant, but _λ_median increases with m, as predicted by theory. The reason is that when m increases, more SNPs (in LD with the causal variants) will depart from the null distribution (_χ_12) so that the median of _χ_2-statistics will deviate more from the expected median of (_χ_12), whereas the effect of each locus decreases as constrained by the heritability, so that the mean test statistic remains the same. Given _h_2 and m, we predicted _λ_mean and _λ_median by theory, but conditional on the observed LD structure. The LD structure is important because there are many SNPs in LD with each causal variant and so many SNPs have an inflated _χ_2 and this increases the mean and to a less extent the median. We used the LD between SNPs as a proxy for the LD between SNPs and causal variants. In general, the predicted _λ_mean and λ_median agree well with those observed from simulations (Figure 1). For a particular data set, when m is large (eg, m_>10), _λ_mean depends only on trait heritability.
Figure 1
Genomic inflation factor observed in simulation versus that predicted by theory. Data are simulated based on real genotypes of 3925 individuals and 294 831 SNPs with different numbers of causal variants (_m_=1, 10, 50, 100, 500 and 1000) and heritabilities (_h_2=0.2, 0.4 and 0.8). Each column represents the average of _λ_mean (a and c) or _λ_median (b and d) observed from 100 simulations. Error bars are SD. Each marked line represents the predicted _λ_mean or _λ_median averaged over 100 prediction replicates given m and _h_2. For case–control studies (c and d), _h_2 refers to heritability of liability on the underlying scale.
Figure 2
Genomic inflation factor for pruned (or selected) SNPs in simulation study. GWAS for quantitative trait is simulated based on real genotypes of 3925 individuals and 294 831 SNPs with heritability of 0.8 and with different numbers of causal variants (10, 50, 100, 500 and 1000). Each column represents an average of _λ_mean (b, d and f) or _λ_median (a, c and e) observed from 100 simulations. Error bars are SD. In (a and b), SNPs are pruned for LD using PLINK22 with threshold _r_2 value of 0.1, 0.3, 0.5 and 0.7. In (c and d), SNPs are pruned based on physical distance so that any pair of SNPs are at least 1 Mb away from each other. In (e and f), 10, 30, 50 and 70% SNPs are randomly sampled from all of the SNPs.
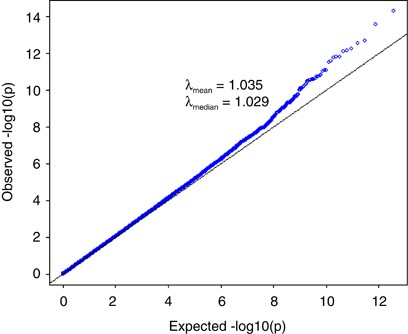
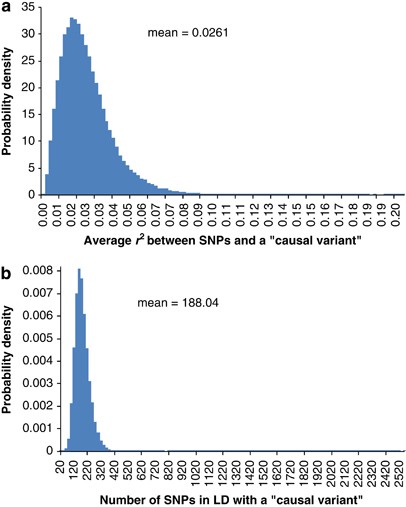
We performed standard GWAS of height using the QIMR data set and observed _λ_mean=1.035 and _λ_median=1.029 (Figure 3). We have shown previously that there is no evidence of population structure in this data set (Supplementary Figures 2 and 3 and Supplementary Tables 1 and 2 of ref. 21). We searched for SNPs in LD with 100 000 randomly selected loci and estimated an average of 188 SNPs that are in LD with each locus, with an average _r_2 of 0.026 (Figure 4). We have previously estimated in this data that 45% of phenotypic variation for height can be explained by ∼295K common SNPs.21 Assuming that the unobserved causal variants are similar to random SNPs with respect to allele frequency and LD, we estimated _h_2=0.54 (SE=0.1) after adjustment for imperfect LD between the causal variants and SNPs.21 Given _h_2=0.54, we predicted _λ_median to be from 1.028 to 1.035 assuming that the number of causal variants for height ranges from 1000 to 4000 (Figure 5a), consistent with an observed _λ_median of 1.029 and with height being highly polygenic.
Figure 3
Quantile–quantile plot of height association result for QIMR data set (3925 unrelated individuals and 294 831 SNPs). All the SNPs passed stringent quality control and all the individuals are of European ancestry as verified by SNP data. The mean and median of _χ_2-statistics are 1.035 and 1.029, respectively.
Figure 4
Histograms of (a) number of SNPs in significant LD with a ‘causal variant’ and (b) average _r_2 between these SNPs and the ‘causal variant’. The ‘causal variants’ are mimicked by randomly sampling (without replacement) 100 000 out of 294 831 SNPs across the genome. Simple regression is used to test for SNPs in LD with each ‘causal variant’ within 5-Mb distance in either direction.
Figure 5
Predicted median of _χ_2-statistics (_λ_median) of height association study in (a) the QIMR data and (b) the GIANT meta-analysis. Each column is mean±2SD of 25 prediction replicates. The straight lines are the observed _λ_median in real data analyses.
We accessed the test statistics of the discovery set of GIANT meta-analysis (MA) of height with ∼133 000 individuals and ∼2.8-M genotyped and imputed SNPs.5 We excluded ∼636K SNPs with effective sample sizes <126 000 and extracted ∼270K SNPs in common with the QIMR data set. We observed _λ_mean=1.95 and _λ_median=1.55. Assuming that the LD structure that underlies the GIANT MA results is similar to that in the QIMR data and _h_2=0.54, we predicted _λ_median for the GIANT MA to be from 1.32 to 1.59 with the assumption of 1000–4000 causal variants (Figure 5b).
Discussion
We have shown by theory, simulation studies and analysis of multiple data sets that a significant inflation of test statistics is to be expected under polygenic inheritance even when there is no population structure. We have provided options in our software tool GCTA23 to estimate LD structure and perform GWAS simulations, and provided an _R_-script to implement the theoretical predictions as described above (http://gump.qimr.edu.au/gcta/gc). Of course, we are not denying that there may be spurious associations because of population structure for single SNPs,14, 16 but are questioning whether _λ_mean or _λ_median is an appropriate statistic to indict and adjust for population structure. In the absence of population structure, _λ_mean reflects the trait heritability and _λ_median further reflects the number of causal variants.
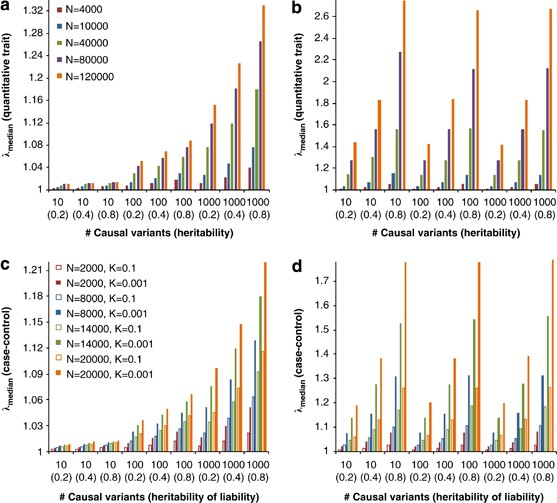
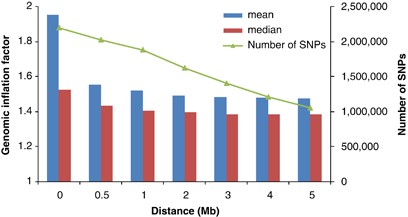
Standard GC theory predicts that the expected value of _λ_mean and _λ_median are the same,9, 10 because the distribution of the test statistic is a scaled (_χ_12). Under polygenic inheritance, however, _λ_mean and _λ_median show explicitly different patterns with different sample size, heritability and disease prevalence (Figure 6). Results from the GIANT MA also show a much larger _λ_mean than _λ_median, as predicted from the polygenic model. When removing SNPs within d Mb (_d_=0.5, 1, …, or 5) of the 318 top hits (180 hits at genome-wide false-positive rate of 0.05 and additional 138 hits at genome-wide false discovery rate of 0.05) from ∼2.2-M SNPs in the GIANT MA, _λ_mean decreases from 1.95 to 1.48 and _λ_median decreases from 1.53 to 1.39, but they do not converge, consistent with polygenic inheritance (Figure 7). Adjustment for GC in large meta-analyses may therefore be too conservative and reduce the power to detect significant SNP-trait associations.
Figure 6
Predicted genomic inflation factor for quantitative trait (a and b) and case–control (c and d) association studies. Prediction is based on 294 831 SNPs with different numbers of causal variants and heritabilities (_h_2), sample size (N) and disease prevalences (K, for case–control study). Each value is an average over 100 prediction replicates. For the case–control study, the number of cases and controls is equal.
Figure 7
Genomic inflation factor for ∼2.2-M SNPs (with exclusion of ∼636K with effective sample sizes <126 000 from the total ∼2.8 M SNPs) in GIANT meta-analysis for height with ∼133 000 samples. A total of 318 top hits were identified by GIANT meta-analysis (genome-wide false discovery rate of 0.05).5 Any SNP within d Mb distance (_d_=0.5, 1, …, or 5, _x_-axis) of the top hits is removed and genomic inflation factor is calculated using all of the remaining SNPs.
In the presence of both population structure and polygenic inheritance (which may be regarded as a general case in practice), we cannot distinguish whether population structure or polygenic inheritance is the major cause of the genomic inflation unless we are able to estimate the proportion of phenotypic variance explained by all the SNPs and that attributed to population structure. It may be possible to discriminate polygenic inheritance from population structure by testing for associations between markers on different chromosomes. Population structure, including the presence of cryptic relationships among individuals in the sample, implies a correlation between alleles on different chromosomes. A genome-wide inflation of the test statistic with little or without such correlation is a strong support for polygenic variation.
References
- Hindorff LA, Sethupathy P, Junkins HA et al: Potential etiologic and functional implications of genome-wide association loci for human diseases and traits. Proc Natl Acad Sci USA 2009; 106: 9362–9367.
Article CAS PubMed PubMed Central Google Scholar - Maher B : Personal genomes: the case of the missing heritability. Nature 2008; 456: 18–21.
Article CAS PubMed Google Scholar - Manolio TA, Collins FS, Cox NJ et al: Finding the missing heritability of complex diseases. Nature 2009; 461: 747–753.
Article CAS PubMed PubMed Central Google Scholar - Speliotes EK, Willer CJ, Berndt SI et al: Association analyses of 249 796 individuals reveal 18 new loci associated with body mass index. Nat Genet 2010; 42: 937–948.
Article CAS PubMed PubMed Central Google Scholar - Lango Allen H, Estrada K, Lettre G et al: Hundreds of variants clustered in genomic loci and biological pathways affect human height. Nature 2010; 467: 832–838.
Article CAS PubMed PubMed Central Google Scholar - Heid IM, Jackson AU, Randall JC et al: Meta-analysis identifies 13 new loci associated with waist-hip ratio and reveals sexual dimorphism in the genetic basis of fat distribution. Nat Genet 2010; 42: 949–960.
Article CAS PubMed PubMed Central Google Scholar - Franke A, McGovern DPB, Barrett JC et al: Genome-wide meta-analysis increases to 71 the number of confirmed Crohn's disease susceptibility loci. Nat Genet 2010; 42: 1118–1125.
Article CAS PubMed PubMed Central Google Scholar - Teslovich TM, Musunuru K, Smith AV et al: Biological, clinical and population relevance of 95 loci for blood lipids. Nature 2010; 466: 707–713.
Article CAS PubMed PubMed Central Google Scholar - Devlin B, Roeder K : Genomic control for association studies. Biometrics 1999; 55: 997–1004.
Article CAS PubMed Google Scholar - Reich DE, Goldstein DB : Detecting association in a case-control study while correcting for population stratification. Genet Epidemiol 2001; 20: 4–16.
Article CAS PubMed Google Scholar - Zheng G, Freidlin B, Gastwirth JL : Robust genomic control for association studies. Am J Hum Genet 2006; 78: 350–356.
Article CAS PubMed Google Scholar - Cardon LR, Palmer LJ : Population stratification and spurious allelic association. The Lancet 2003; 361: 598–604.
Article Google Scholar - Marchini J, Cardon LR, Phillips MS, Donnelly P : The effects of human population structure on large genetic association studies. Nat Genet 2004; 36: 512–517.
Article CAS PubMed Google Scholar - Campbell CD, Ogburn EL, Lunetta KL et al: Demonstrating stratification in a European American population. Nat Genet 2005; 37: 868–872.
Article CAS PubMed Google Scholar - Hao K, Li C, Rosenow C, Wong WH : Detect and adjust for population stratification in population-based association study using genomic control markers: an application of Affymetrix Genechip Human Mapping 10 K array. Eur J Hum Genet 2004; 12: 1001–1006.
Article CAS PubMed Google Scholar - WTCCC: Genome-wide association study of 14 000 cases of seven common diseases and 3000 shared controls. Nature 2007; 447: 661–678.
Article Google Scholar - Chapman JM, Cooper JD, Todd JA, Clayton DG : Detecting disease associations due to linkage disequilibrium using haplotype tags: a class of tests and the determinants of statistical power. Hum Hered 2003; 56: 18–31.
Article PubMed Google Scholar - Spencer CC, Su Z, Donnelly P, Marchini J : Designing genome-wide association studies: sample size, power, imputation, and the choice of genotyping chip. PLoS Genet 2009; 5: e1000477.
Article PubMed PubMed Central Google Scholar - Purcell SM, Wray NR, Stone JL et al: Common polygenic variation contributes to risk of schizophrenia and bipolar disorder. Nature 2009; 460: 748–752.
CAS PubMed Google Scholar - Yang J, Wray NR, Visscher PM : Comparing apples and oranges: equating the power of case-control and quantitative trait association studies. Genet Epidemiol 2010; 34: 254–257.
Article PubMed Google Scholar - Yang J, Benyamin B, McEvoy BP et al: Common SNPs explain a large proportion of the heritability for human height. Nat Genet 2010; 42: 565–569.
Article CAS PubMed PubMed Central Google Scholar - Purcell S, Neale B, Todd-Brown K et al: PLINK: a tool set for whole-genome association and population-based linkage analyses. Am J Hum Genet 2007; 81: 559–575.
Article CAS PubMed PubMed Central Google Scholar - Yang J, Lee SH, Goddard ME, Visscher PM : GCTA: a tool for genome-wide complex trait analysis. Am J Hum Genet 2010; 88: 76–82.
Article PubMed Google Scholar
Acknowledgements
We thank all three reviewers for helpful comments. We acknowledge funding from the Australian National Health and Medical Research Council (NHMRC Grants 389891, 389892, 613672 and 613601), the Australian Research Council (ARC Grants DP0770096 and DP1093900) and the US National Institute of Health (NIH Grants AA13320, AA13321 and DA12854).
Author information
Authors and Affiliations
- Queensland Institute of Medical Research, Brisbane, Queensland, Australia
Jian Yang, Dale R Nyholt, Nicholas G Martin, Grant W Montgomery & Peter M Visscher - Genetics of Complex Traits, Peninsula College of Medicine and Dentistry, University of Exeter, Exeter, UK
Michael N Weedon & Timothy M Frayling - Broad Institute, Cambridge, MA, USA
Shaun Purcell & Joel N Hirschhorn - Center for Human Genetic Research, Massachusetts General Hospital, Boston, MA, USA
Shaun Purcell - Montreal Heart Institute (Research Center), Université de Montréal, Montréal, Québec, Canada
Guillaume Lettre - Departments of Internal Medicine, Rotterdam, The Netherlands
Karol Estrada - Department of Biostatistics, University of Michigan, Ann Arbor, MI, USA
Cristen J Willer - Icelandic Heart Association, Heart Preventive Clinic and Research Institute, Kopavogur, Iceland
Albert V Smith - Department of Medical Epidemiology and Biostatistics, Karolinska Institute, Stockholm, Sweden
Erik Ingelsson - Department of Medicine, University of Maryland School of Medicine, Baltimore, MD, USA
Jeffrey R O'Connell - Twin Research and Genetic Epidemiology Department, King's College London St Thomas’ Hospital, London, UK
Massimo Mangino - Wellcome Trust Centre for Human Genetics, University of Oxford, Oxford, UK
Reedik Mägi & Mark I McCarthy - Department of Psychiatry, Washington University, St Louis, MO, USA
Pamela A Madden & Andrew C Heath - Program in Genomics and Divisions of Genetics and Endocrinology, Children's Hospital, Boston, MA, USA
Joel N Hirschhorn - Department of Genetics, Harvard Medical School, Boston, MA, USA
Joel N Hirschhorn - Oxford Centre for Diabetes, Endocrinology and Metabolism, Oxford, UK
Mark I McCarthy - Department of Food and Agricultural Systems, University of Melbourne, Parkville, Victoria, Australia
Michael E Goddard
Authors
- Jian Yang
You can also search for this author inPubMed Google Scholar - Michael N Weedon
You can also search for this author inPubMed Google Scholar - Shaun Purcell
You can also search for this author inPubMed Google Scholar - Guillaume Lettre
You can also search for this author inPubMed Google Scholar - Karol Estrada
You can also search for this author inPubMed Google Scholar - Cristen J Willer
You can also search for this author inPubMed Google Scholar - Albert V Smith
You can also search for this author inPubMed Google Scholar - Erik Ingelsson
You can also search for this author inPubMed Google Scholar - Jeffrey R O'Connell
You can also search for this author inPubMed Google Scholar - Massimo Mangino
You can also search for this author inPubMed Google Scholar - Reedik Mägi
You can also search for this author inPubMed Google Scholar - Pamela A Madden
You can also search for this author inPubMed Google Scholar - Andrew C Heath
You can also search for this author inPubMed Google Scholar - Dale R Nyholt
You can also search for this author inPubMed Google Scholar - Nicholas G Martin
You can also search for this author inPubMed Google Scholar - Grant W Montgomery
You can also search for this author inPubMed Google Scholar - Timothy M Frayling
You can also search for this author inPubMed Google Scholar - Joel N Hirschhorn
You can also search for this author inPubMed Google Scholar - Mark I McCarthy
You can also search for this author inPubMed Google Scholar - Michael E Goddard
You can also search for this author inPubMed Google Scholar - Peter M Visscher
You can also search for this author inPubMed Google Scholar
Consortia
the GIANT Consortium
Corresponding author
Correspondence toJian Yang.
Ethics declarations
Competing interests
The authors declare no conflict of interest.
Rights and permissions
About this article
Cite this article
Yang, J., Weedon, M., Purcell, S. et al. Genomic inflation factors under polygenic inheritance.Eur J Hum Genet 19, 807–812 (2011). https://doi.org/10.1038/ejhg.2011.39
- Received: 28 July 2010
- Revised: 24 January 2011
- Accepted: 28 January 2011
- Published: 16 March 2011
- Issue Date: July 2011
- DOI: https://doi.org/10.1038/ejhg.2011.39
