kfoldPredict - Classify observations in cross-validated linear classification model - MATLAB (original) (raw)
Classify observations in cross-validated linear classification model
Syntax
Description
[Label](#bu6uj3g-1-Label) = kfoldPredict([CVMdl](#bu6uj3g-1%5Fsep%5Fshared-CVMdl)) returns cross-validated class labels predicted by the cross-validated, binary, linear classification model CVMdl. That is, for every fold,kfoldPredict predicts class labels for observations that it holds out when it trains using all other observations.
Label contains predicted class labels for each regularization strength in the linear classification models that compose CVMdl.
[[Label](#bu6uj3g-1-Label),[Score](#bu6uj3g-1-Score)] = kfoldPredict([CVMdl](#bu6uj3g-1%5Fsep%5Fshared-CVMdl)) also returns cross-validated classification scores for both classes. Score contains classification scores for each regularization strength in CVMdl.
Examples
Load the NLP data set.
X is a sparse matrix of predictor data, and Y is a categorical vector of class labels. There are more than two classes in the data.
The models should identify whether the word counts in a web page are from the Statistics and Machine Learning Toolbox™ documentation. So, identify the labels that correspond to the Statistics and Machine Learning Toolbox™ documentation web pages.
Cross-validate a binary, linear classification model using the entire data set, which can identify whether the word counts in a documentation web page are from the Statistics and Machine Learning Toolbox™ documentation.
rng(1); % For reproducibility CVMdl = fitclinear(X,Ystats,'CrossVal','on'); Mdl1 = CVMdl.Trained{1}
Mdl1 = ClassificationLinear ResponseName: 'Y' ClassNames: [0 1] ScoreTransform: 'none' Beta: [34023×1 double] Bias: -1.0008 Lambda: 3.5193e-05 Learner: 'svm'
Properties, Methods
CVMdl is a ClassificationPartitionedLinear model. By default, the software implements 10-fold cross validation. You can alter the number of folds using the 'KFold' name-value pair argument.
Predict labels for the observations that fitclinear did not use in training the folds.
label = kfoldPredict(CVMdl);
Because there is one regularization strength in Mdl1, label is a column vector of predictions containing as many rows as observations in X.
Construct a confusion matrix.
ConfusionTrain = confusionchart(Ystats,label);
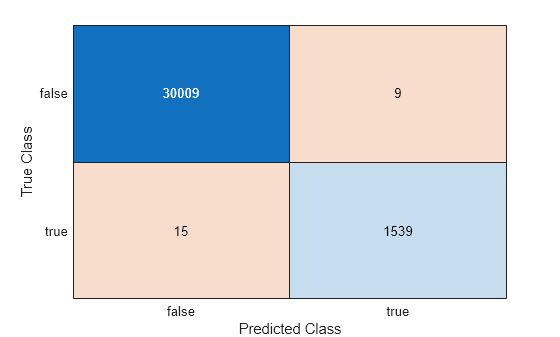
The model misclassifies 15 'stats' documentation pages as being outside of the Statistics and Machine Learning Toolbox documentation, and misclassifies nine pages as 'stats' pages.
Linear classification models return posterior probabilities for logistic regression learners only.
Load the NLP data set and preprocess it as in Predict k-fold Cross-Validation Labels. Transpose the predictor data matrix.
load nlpdata Ystats = Y == 'stats'; X = X';
Cross-validate binary, linear classification models using 5-fold cross-validation. Optimize the objective function using SpaRSA. Lower the tolerance on the gradient of the objective function to 1e-8.
rng(10); % For reproducibility CVMdl = fitclinear(X,Ystats,'ObservationsIn','columns',... 'KFold',5,'Learner','logistic','Solver','sparsa',... 'Regularization','lasso','GradientTolerance',1e-8);
Predict the posterior class probabilities for observations not used to train each fold.
[~,posterior] = kfoldPredict(CVMdl); CVMdl.ClassNames
ans = 2×1 logical array
0 1
Because there is one regularization strength in CVMdl, posterior is a matrix with 2 columns and rows equal to the number of observations. Column i contains posterior probabilities of Mdl.ClassNames(i) given a particular observation.
Compute the performance metrics (true positive rates and false positive rates) for a ROC curve and find the area under the ROC curve (AUC) value by creating a rocmetrics object.
rocObj = rocmetrics(Ystats,posterior,CVMdl.ClassNames);
Plot the ROC curve for the second class by using the plot function of rocmetrics.
plot(rocObj,ClassNames=CVMdl.ClassNames(2))
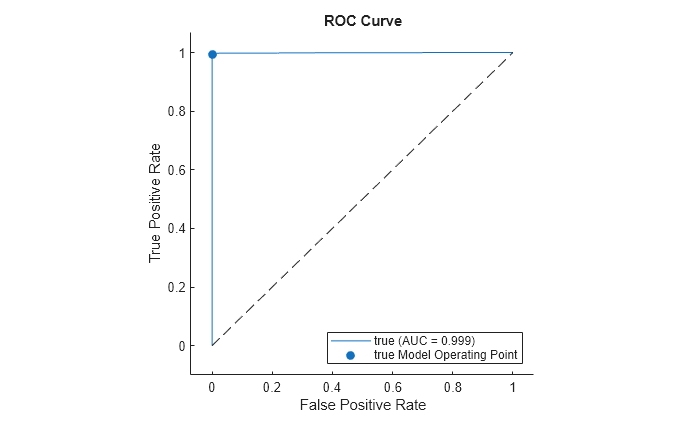
The ROC curve indicates that the model classifies the validation observations almost perfectly.
To determine a good lasso-penalty strength for a linear classification model that uses a logistic regression learner, compare cross-validated AUC values.
Load the NLP data set. Preprocess the data as in Estimate k-fold Cross-Validation Posterior Class Probabilities.
load nlpdata Ystats = Y == 'stats'; X = X';
There are 9471 observations in the test sample.
Create a set of 11 logarithmically-spaced regularization strengths from 10-6 through 10-0.5.
Lambda = logspace(-6,-0.5,11);
Cross-validate a binary, linear classification models that use each of the regularization strengths and 5-fold cross-validation. Optimize the objective function using SpaRSA. Lower the tolerance on the gradient of the objective function to 1e-8.
rng(10) % For reproducibility CVMdl = fitclinear(X,Ystats,'ObservationsIn','columns', ... 'KFold',5,'Learner','logistic','Solver','sparsa', ... 'Regularization','lasso','Lambda',Lambda,'GradientTolerance',1e-8)
CVMdl = ClassificationPartitionedLinear CrossValidatedModel: 'Linear' ResponseName: 'Y' NumObservations: 31572 KFold: 5 Partition: [1×1 cvpartition] ClassNames: [0 1] ScoreTransform: 'none'
Properties, Methods
Mdl1 = ClassificationLinear ResponseName: 'Y' ClassNames: [0 1] ScoreTransform: 'logit' Beta: [34023×11 double] Bias: [-13.2936 -13.2936 -13.2936 -13.2936 -13.2936 -6.8954 -5.4359 -4.7170 -3.4108 -3.1566 -2.9792] Lambda: [1.0000e-06 3.5481e-06 1.2589e-05 4.4668e-05 1.5849e-04 5.6234e-04 0.0020 0.0071 0.0251 0.0891 0.3162] Learner: 'logistic'
Properties, Methods
Mdl1 is a ClassificationLinear model object. Because Lambda is a sequence of regularization strengths, you can think of Mdl1 as 11 models, one for each regularization strength in Lambda.
Predict the cross-validated labels and posterior class probabilities.
[label,posterior] = kfoldPredict(CVMdl); CVMdl.ClassNames; [n,K,L] = size(posterior)
label is a 31572-by-11 matrix of predicted labels. Each column corresponds to the predicted labels of the model trained using the corresponding regularization strength. posterior is a 31572-by-2-by-11 matrix of posterior class probabilities. Columns correspond to classes and pages correspond to regularization strengths. For example, posterior(3,1,5) indicates that the posterior probability that the first class (label 0) is assigned to observation 3 by the model that uses Lambda(5) as a regularization strength is 1.0000.
For each model, compute the AUC by using rocmetrics.
auc = 1:numel(Lambda); % Preallocation for j = 1:numel(Lambda) rocObj = rocmetrics(Ystats,posterior(:,:,j),CVMdl.ClassNames); auc(j) = rocObj.AUC(1); end
Higher values of Lambda lead to predictor variable sparsity, which is a good quality of a classifier. For each regularization strength, train a linear classification model using the entire data set and the same options as when you trained the model. Determine the number of nonzero coefficients per model.
Mdl = fitclinear(X,Ystats,'ObservationsIn','columns', ... 'Learner','logistic','Solver','sparsa','Regularization','lasso', ... 'Lambda',Lambda,'GradientTolerance',1e-8); numNZCoeff = sum(Mdl.Beta~=0);
In the same figure, plot the test-sample error rates and frequency of nonzero coefficients for each regularization strength. Plot all variables on the log scale.
figure yyaxis left plot(log10(Lambda),log10(auc),'o-') ylabel('log_{10} AUC') yyaxis right plot(log10(Lambda),log10(numNZCoeff + 1),'o-') ylabel('log_{10} nonzero-coefficient frequency') xlabel('log_{10} Lambda') title('Cross-Validated Statistics') hold off
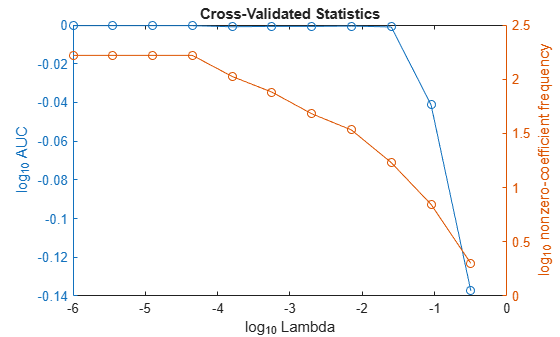
Choose the index of the regularization strength that balances predictor variable sparsity and high AUC. In this case, a value between 10-3 to 10-1 should suffice.
Select the model from Mdl with the chosen regularization strength.
MdlFinal = selectModels(Mdl,idxFinal);
MdlFinal is a ClassificationLinear model containing one regularization strength. To estimate labels for new observations, pass MdlFinal and the new data to predict.
Input Arguments
Output Arguments
Cross-validated, predicted class labels, returned as a categorical or character array, logical or numeric matrix, or cell array of character vectors.
In most cases, Label is an n_-by-L array of the same data type as the observed class labels (see Y) used to createCVMdl. (The software treats string arrays as cell arrays of character vectors.) n is the number of observations in the predictor data (see X) and_L is the number of regularization strengths inCVMdl.Trained{1}.Lambda. That is,Label(_`i`_,_`j`_) is the predicted class label for observation i using the linear classification model that has regularization strengthCVMdl.Trained{1}.Lambda(_`j`_).
If Y is a character array and L > 1, then Label is a cell array of class labels.
Cross-validated classification scores, returned as an_n_-by-2-by-L numeric array.n is the number of observations in the predictor data that created CVMdl (see X) and_L_ is the number of regularization strengths inCVMdl.Trained{1}.Lambda.Score(_`i`_,_`k`_,_`j`_) is the score for classifying observation i into class k using the linear classification model that has regularization strengthCVMdl.Trained{1}.Lambda(_`j`_).CVMdl.ClassNames stores the order of the classes.
If CVMdl.Trained{1}.Learner is 'logistic', then classification scores are posterior probabilities.
More About
For linear classification models, the raw classification score for classifying the observation x, a row vector, into the positive class is defined by
For the model with regularization strength j, βj is the estimated column vector of coefficients (the model propertyBeta(:,j)) and bj is the estimated, scalar bias (the model propertyBias(j)).
The raw classification score for classifying x into the negative class is –f(x). The software classifies observations into the class that yields the positive score.
If the linear classification model consists of logistic regression learners, then the software applies the 'logit' score transformation to the raw classification scores (see ScoreTransform).
Extended Capabilities
Version History
Introduced in R2016a
kfoldPredict fully supports GPU arrays.
Starting in R2023b, the following classification model object functions use observations with missing predictor values as part of resubstitution ("resub") and cross-validation ("kfold") computations for classification edges, losses, margins, and predictions.
In previous releases, the software omitted observations with missing predictor values from the resubstitution and cross-validation computations.