Maths Formulas for Class 8 (original) (raw)
Last Updated : 23 Jul, 2025
Class 8 is a crucial stage in a student’s mathematical journey. The topics introduced here form the foundation for advanced concepts in higher classes. From algebra and geometry to data handling and measurement, students must understand and apply various formulas accurately to solve problems efficiently. This article presents a complete list of important formulas from the CBSE Class 8 Maths syllabus, organized chapter-wise for easy reference and revision.
Below is a list of all the essential formulas for Class 8 Mathematics, organized by chapter, along with illustrations for better understanding.
Chapter 1: Rational Numbers
A rational number is any number that can be written as the fraction (p/q), where p and q are integers and q can't be zero. Example: 1⁄2, 4/3 ,5/7 ,1 etc.This chapter covers the different types of rational numbers, their properties, and operations.
Here we will discuss various formulas to solve the questions related to rational numbers.
| Type of Numbers | Description |
|---|---|
| Natural Numbers | N = {1, 2, 3, 4, 5, ...}, also called the counting numbers. |
| Whole number | W = {0, 1, 2, 3, 4, 5, ...}, it is the counting numbers + zero. |
| Integers | Z = {..., -7, -6, -5, -4, -3, -2, -1, 0, 1, 2, 3, 4, 5, 6, ...}. |
| Positive integers | Z+ = {1, 2, 3, 4, 5, ........}. |
| Negative integers | Z- = {..., -7, -6, -5, -4, -3, -2, -1}. |
**Properties of Rational Numbers:
- **Additive Identity: \frac{a}{b} + 0 = \frac{a}{b}
- **Multiplicative Identity: \frac{a}{b} \times 1 = \frac{a}{b}
- **Additive Inverse: \frac{a}{b} + (-\frac{a}{b}) = 0
- **Multiplicative Inverse: \frac{a}{b} \times \frac{b}{a} = 1
**Closure Property –
- **Addition: For any two rational numbers a and b, a + b is also a rational number.
- **Subtraction: For any two rational numbers a and b, a – b is also a rational number.
- **Multiplication: For any two rational numbers a and b, a × b is also a rational number.
- **Division: Rational numbers are not closed under division.
**Commutative Property –
- **Addition: For any rational numbers a and b, a + b = b + a.
- **Subtraction: For any rational numbers a and b, a – b ≠ b – a.
- **Multiplication: For any rational numbers a and b, (a x b) = (b x a).
- **Division: For any rational numbers a and b, (a/b) ≠ (b/a).
**Associative Property -
- Addition: For any rational numbers a, b, and c, (a + b) + c = a + (b + c).
- **Subtraction: For any rational numbers a, b, and c, (a – b) – c ≠ a – (b – c)
- **Multiplication: For any rational number a, b, and c, (a x b) x c = a x (b x c).
- **Division: For any rational numbers a, b, and c, (a / b) / c ≠ a / (b / c).
**Distributive Property -
For any three rational numbers a, b and c, a × ( b + c ) = (a × b) +( a × c).
**➣ Learn All About Rational Numbers - [Read Here!]
Chapter 2: Linear Equations in One Variable
A **linear equation in one variable is an equation that involves **only one variable, raised to the **power of 1, and does **not include any products of variables. It is denoted as ax+b = 0, where a and b are any two integers, and x is a variable and consists of only one solution. The equation of this type has only one solution.
There are four different ways to solve Linear equations in one variable:
1. Linear Expressions on One Side and Numbers on the Other Side
Solving Equations which have Linear Expressions on One Side and Numbers on the Other Side.
**Steps to Solve:
- Transpose the number to the side where all numbers are present, maintaining the sign of the number.
- Solve (Add/subtract) the equation on both sides to get it as simpler as possible, to obtain the value of the variable.
**2. Variable on both Sides
Solving Equations having the Variables on both the sides.
**Steps to Solve:
- Bring all variable terms to one side and constants to the other.
- Combine like terms.
- Solve for the variable.
3. **Number in the denominator and variables on both Sides
Solving the Linear equations of the type that has a **number in the denominator and variables on both sides
**Steps to Solve:
- Find the **LCM (Least Common Multiple) of the denominators on both sides.
- **Multiply both sides of the equation by the LCM to eliminate the denominators.
- **Simplify the resulting equation and solve for x.
4. Reducible Linear Equations
These equations can be transformed into a linear form.
**Steps to Solve:
- Such equations are of the form: ****(x + a / x + b) = c / d**.
- Therefore, these equations are solved by the cross-multiplying numerator and denominator to get it into a simple linear form like ****(x + a) d = c (x + b)**.
- This is a Linear equation of the type that has variables on both sides which can be solved further to obtain the value of the variable.
**➣ Learn All About Linear Equations - [Read Here!]
Chapter 3: Understanding Quadrilaterals
Before understanding Quadrilaterals and the types of Quadrilaterals, it is important to understand what a polygon is.
Polygon
A **polygon is a **closed figure formed by a finite number of line segments, where the segments are called **sides, and the points where they meet are called **vertices (plural of vertex). Polygons are fundamental shapes in geometry.
**Classification of Polygons****:** The polygons are classified according to the number of sides (or vertices) they have, as mentioned below:
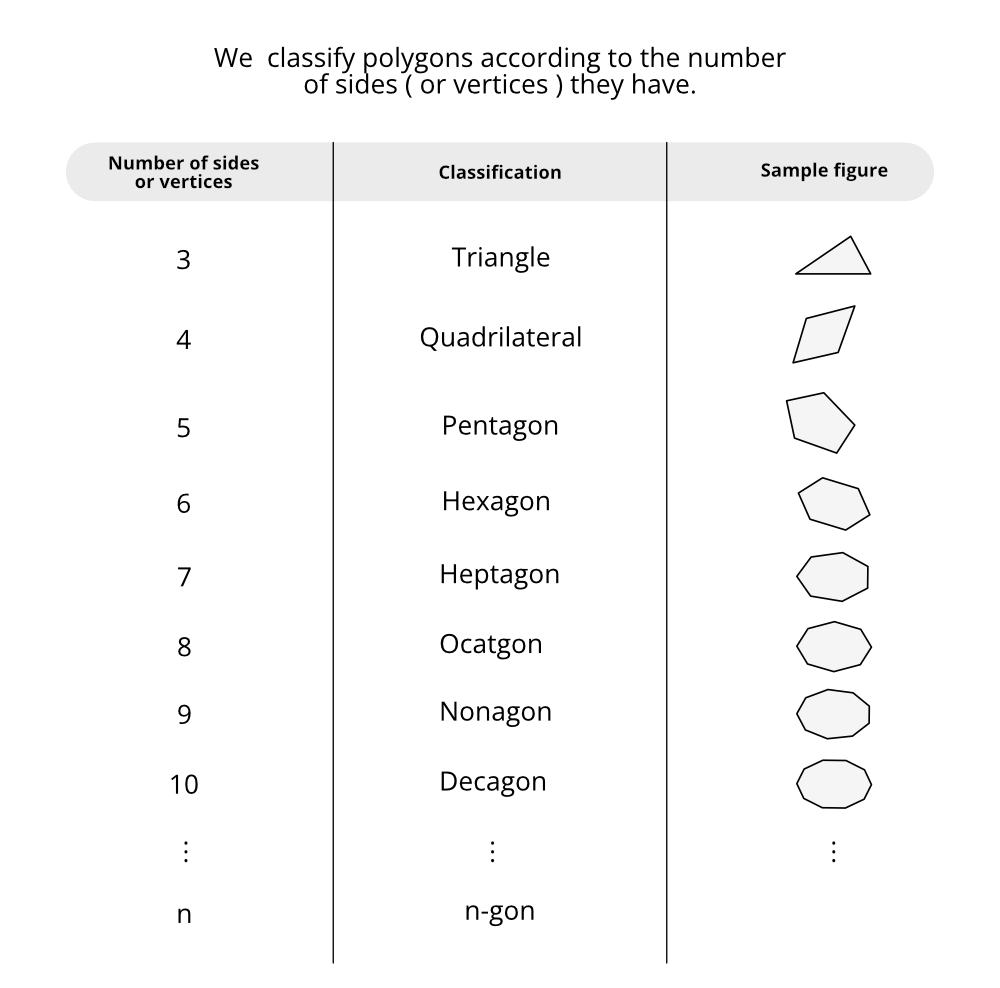
Classifcation of Polygons
- **Angle Sum Property****:** This property states that the sum of all angles of a quadrilateral is 360°.
- **Sum of the Measures of the Exterior Angles of a Polygon****:** Regardless of the number of sides in the polygons, the total of the measurements of the exterior angles equals 360 degrees.
Let us now understand the following important notes about the formulae discussed in this section.
Quadrilateral
A quadrilateral is a closed object with four sides, four vertices, and four angles. It is a type of polygon that is formed by joining four non-collinear points.
**Note: The sum of a quadrilateral's internal angles is always 360 degrees.
**Types of Quadrilateral****:** The measurements of the angles and lengths of the sides of quadrilaterals are used to classify them.
- The total space occupied by the figure is the quadrilateral’s area.
- The perimeter of a two-dimensional form is the entire distance covered by its boundaries.
The following are the properties, area, and perimeter equations for the various quadrilaterals:
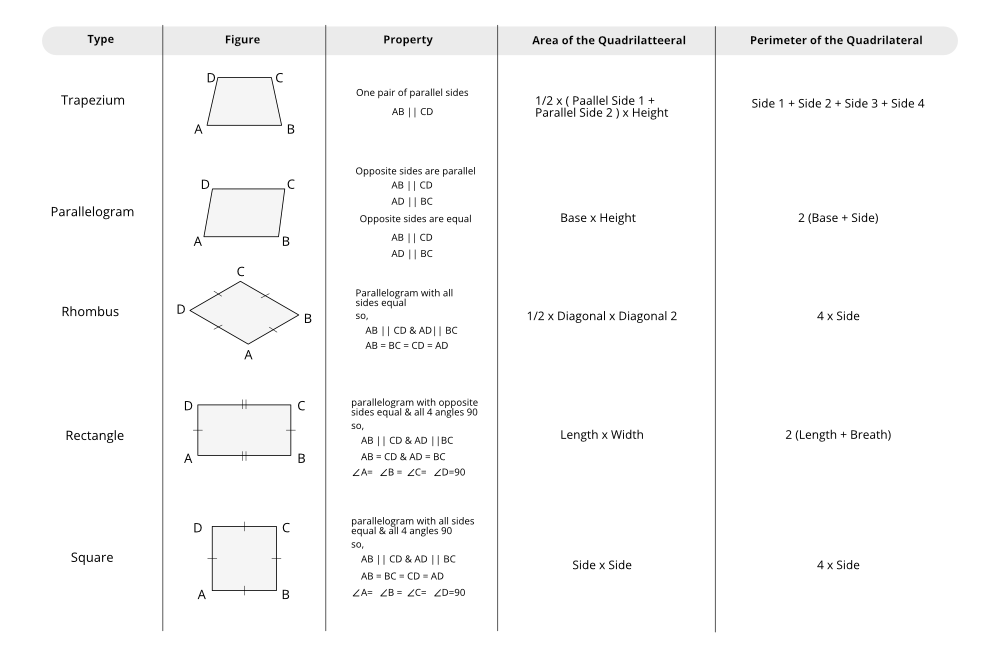
Important Quadrilaterlas formulas for class 8
**➣ Learn All About Quadrilaterals - [Read Here!]
Chapter 4: Data Handling
Data handling refers to the process of collecting, organizing, and presenting any raw information in a way that is helpful to others like in graphs or charts, etc.
**Data: Data is a systematic record of facts or distinct values of a quantity.
**Key Features of data:
**Presentation: Arranging data in an order to study their most important features.
**Frequency: It is defined as the number of times a particular entity occurs.
**Frequency Distribution Table: Table that shows the frequency of different values in the given data.
**Grouped Frequency Distribution Table: A table that shows the frequency of groups of values in the given data.
**Classes or Class- intervals: The groupings used to group the values in given data.
**Class Size: The number of values that each class contains is called the class size or class width.
**Class Limit:
- The lower value in a class iscalled the lower class limit.
- The highervalue in a class is called the upper classlimit.
- The common observation will belong to the higher class.
**Graphical representation of data:
We will discuss various data representation methods along with their graphical representation in this article in **chapter 13 Introduction to Graph later.
- **Pictograph: Pictorial representation of data using symbols
- **Bar Graph****:** A display of information using bars of uniform width, whose heights proportional to the respective values.
- **Double Bar Graph: A bar graph showing two sets of data simultaneously. It is useful for the comparison of the data.
- **Histogram****:** a graphical representation of frequency distribution in the form of rectangles with class intervals as bases and heights proportional to corresponding frequencies, such that there is no gap between any successive rectangles.
- **Circle Graph or Pie Chart****:** A pictorial representation of the numerical data in the form of sectors of a circle, such that area of each sector is proportional to the magnitude of the data represented by the sector.
- **Probability= Number of outcomes making up an event / Total number of outcomes, if the outcomes are equally likely.
**➣ Learn All About Data Handling- [Read Here!]
Chapter 5: Squares and Square Roots
- A square number is a natural number which can be expressed as p2, where n is also a natural number.
Example: 4 is a square number as 4 = 22. The square root is the inverse operation of squaring.
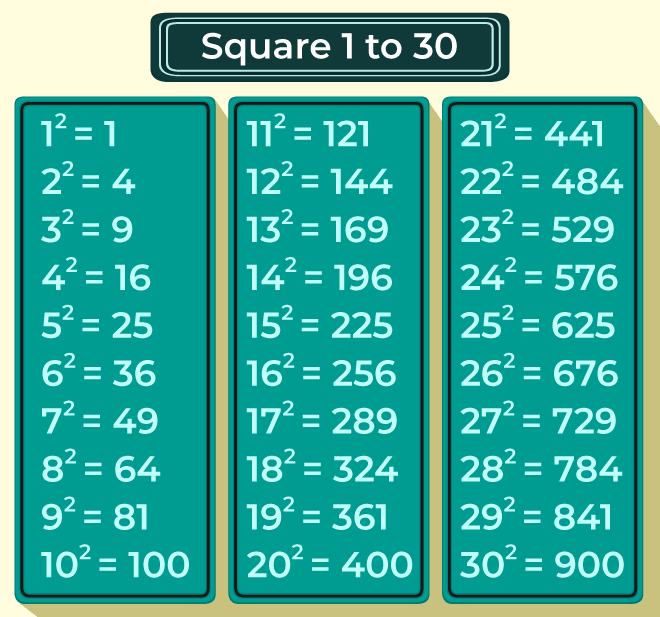
Given below is the image of square numbers from 1 to 30:
**Properties of Square Numbers
- A square number always ends with 0, 1, 4, 5, 6, or 9 (never ends in 2, 3, 7, or 8).
- The number of zeros at the end of a perfect square is even.
- Square numbers of odd numbers are odd, and squares of even numbers are even.
**➣ Learn All About Square and Square Roots - [Read Here!]
Chapter 6: Cubes and Cube Roots
The inverse of the cube formula is the cube root formula. We multiply a number three times to obtain its cube in the cube formula, therefore in this situation, we break down a number to be written as a product of three equal numbers and get the **cube root.
Given below is the list of cubes 1 to 20
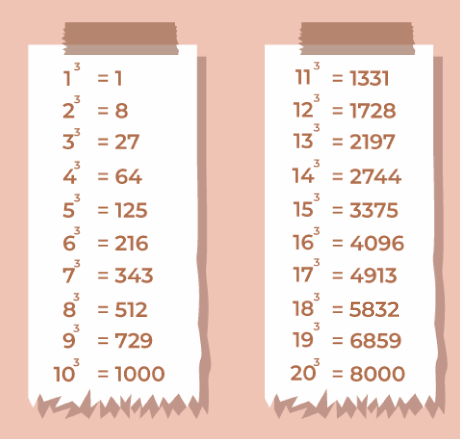
**Properties of Cube Numbers
- Cube of an even number is even.
- Cube of an odd number is odd.
- Cubes of numbers often end in different digits than the original number.
- Every number has one and only one cube root.
Consider any number m, which can be expressed as the product of any number three times as m = n × n × n = n3. n3 is so known as the cube of n and m is now known as cube root of n: 3 √m = n
**➣ Learn All About Cube Roots- [Read Here!]
Chapter 7: Comparing Quantities
Class 8 Comparing Quantities formulas provided here have been thoroughly prepared by experts to assist students in understanding all of the concepts and formulas used in Chapter 8.
The below-mentioned formulas on some important topics like various Taxes such as sales Tax, Value Added Tax, Goods and Services Tax, Profit and Loss, Percent Change & Discounts are intended to assist students in completing timely modifications and achieving higher exam scores.
The following formulas will help students understand the basics of simple arithmetic involving money as follows,
| Term | Formula |
|---|---|
| **Simple Interest (SI) | _Simple Interest = (Principal × Rate × Time)/100 |
| **Compound Interest (CI) | _A = P [1 + (R/100) T ] Compound Interest Formula = Amount - Principal |
| **Profit If SP > CP , then it is a profit | _Selling price – Cost price |
| _Profit Percentage | _(Profit / Cost Price) × 100 |
| **LossIf CP > SP, then it is a loss. | _Cost price – Selling price |
| _Loss Percentage | _(Loss / Cost Price) × 100 |
| **Discount | _Marked Price - Sale Price |
| Discount % | _Discount × 100 / MP |
| **PercentageChange | _Change in Value / Original Value |
| **Sales tax or VAT | _(Cost Price × Rate of Sales Tax) / 100 |
| **Billing Amount | Selling price + VAT |
**➣ Learn All About Ratio and Percentages- [Read Here!]
Chapter 8: Algebraic Expressions and Identities
Algebraic expressions and algebraic identities are presented for class 8, this is a tough chapter in which you must memorize all of the equations and apply them correctly. GeeksforGeeks make it simple for them by putting all of the formulas on one page. Algebraic formulae and algebraic identities for class 8 are, we think, provided here.
Algebraic identities are formulas that are always true for all values of variables. They are used to simplify and expand expressions.
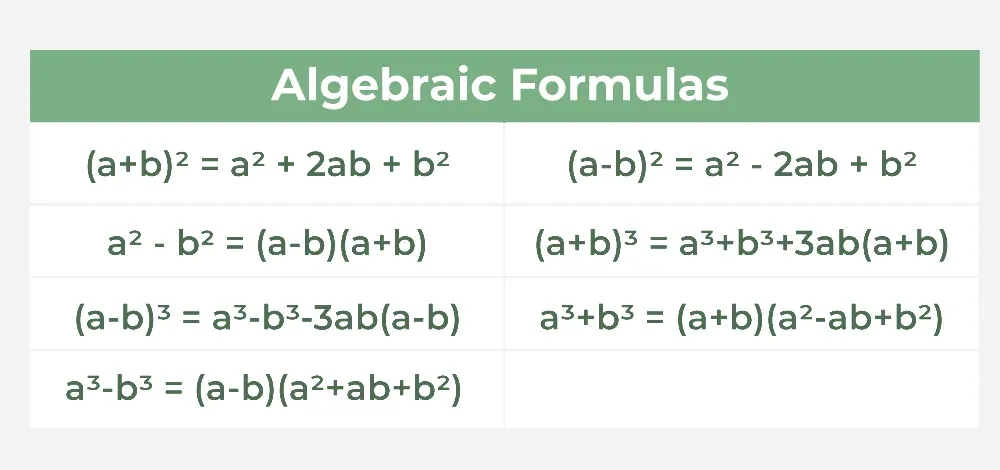
Important Algebric formulas for class 8
**➣ Learn All About Algebric Expressions in Maths- [Read Here!]
Chapter 9: Mensuration
The formulae for Mensuration Class 8 Chapter 9 are listed here. Here you will find mensuration resources based on the CBSE syllabus (2025-2026) and the most recent exam pattern. Work through the formulae and examples to have a better understanding of the idea of mensuration. Mensuration is the process of calculating the area and perimeter of various geometrical forms such as triangles, trapeziums, rectangles, and so on.
**Mensuration formulas is for types of shapes:
**2D Mensuration – Measurement of **flat figures (plane shapes) like:
| Shape | Area | Perimeter / Circumference |
|---|---|---|
| Square | A = a2 | P = 4a |
| Rectangle | A = l × b | P = 2(l + b) P |
| Triangle | A = 12 × b × h | P = a + b + c |
| Circle | A = πr2 | C = 2πr |
| Trapezium | A= 12 (a + b) h | P = a + b + c + d |
| Parallelogram | A = b × h | P = 2(a + b) |
**3D Mensuration – Measurement of **solid figures (space shapes) like:
| Solid | Volume | Surface Area |
|---|---|---|
| Cube | V = a3 | SA = 6a2 |
| Cuboid | V = l × b × h | SA = 2(lb + bh + hl) |
| Cylinder | V = πr2 | TSA = 2πr(h + r) |
| Cone | V=1/3πr2h | TSA = πr(l + r) |
| Sphere | V=4/3πr3 | SA = 4πr2 |
| Hemisphere | V=2/3πr3 | SA = 3πr2 |
**➣ Learn All About Mensuration in Maths- [Read Here!]
Chapter 10: Exponents and Powers
An exponent represents the value which refers to the number of times a number is multiplied by itself. For example, 5 × 5 × 5 can be written as 53. Even very small numbers can be expressed in the form of negative exponents.
**Laws of Exponents
- Law of Product: am × an = am + n
- Law of Quotient: am/an = am - n
- Law of Zero Exponent: a0 = 1
- Law of Negative Exponent: a-m = 1/am
- Law of Power of a Power: (am)n = amn
- Law of Power of a Product: (ab)n = ambm
- Law of Power of a Quotient: (a/b)m = am/bm
Learn All about Exponents in Maths- [Read Here!]
Chapter 11: Direct and Inverse Proportions
To indicate how the quantities and amounts are connected, a direct and inverse proportion is used. Direct proportional and inverse proportional are other terms used to describe them.
**Proportions
Proportion is a mathematical comparison between two numbers. According to proportion, if two sets of given numbers are increasing or decreasing in the same ratio, then the ratios are said to be directly proportional to each other. Proportions are denoted using the symbol "::" or "=".
**Direct Proportion or Variation
Any two quantities a and b can be said to be in direct proportion if they variate (increase or decrease) together with each other in such a way that the ratio of their corresponding values remains the same.
(x1 / y1) = (x2 / y2) or x ∝ y
Quantities that increase or decrease in parallel do not necessarily have to be in direct proportion, and inverse proportion does not always have to be in direct proportion.
**Inverse Proportion
Two quantities x and y are said to be in inverse proportion if an increase in x causes a proportional decrease in y ****(and vice versa**) in such a manner that the product of their corresponding values remains constant.
(x1 . y1) = (x2 .y2) or x ∝ 1/y
**➣ Learn All About Direct and Inverse Proportions- [Read Here!]
Chapter 12: Factorisation
Factorization is one of the most common ways for reducing an Algebraic or Quadratic Equation to its simplest form. As a result, one needs to be familiar with Factorization Formulas in order to decompose a complex equation. Below mentioned is the list of various formulas and properties that are useful to solve the problems of Polynomials, Trigonometry, Algebra, and Quadratic Equations.
**Method to do Factorisation:
**Common Factor Method
- Identify the common factors in all terms of the given expression. The common factors can be Numbers and Variables (if the terms have any)
- Factor out the greatest common factor (GCF) from each term.
- Write the expression as a product of the GCF and the remaining terms.
**For example:
6x2 + 9x
6 and 9 have a common factor of 3.
= 3x(2x + 3)
**Factorisation by regrouping terms
- **Take out the common factor from all terms, if any.
- **Group terms in pairs to find common factors.
- **Factor out the common binomial from both groups.
**For example:
ax + ay + bx + by
=(ax + ay) + (bx + by)
= a(x + y) + b(x + y)
= (x + y)(a + b)
**Factorisation using Identities
- **a 2 + 2ab + b 2 = (a + b) 2
- **a 2 - 2ab + b 2 = (a - b) 2
- **a 2 – b 2 = (a + b) (a - b)
- **x 2 + (a + b)x + ab = (x + a)(x + b)
**Factorisation of the form (x + a)(x + b)
Factorising x2 + px + q :
**Find two numbers aaa and bbb such that:
- a × b = q (the constant term)
- a + b=p (the coefficient of x)
x2 + px + q = x2 + ax + bx = x (x + a) + b(x + a) = (x + a) (x + b)
We have divisions of algebraic expressions in the case of divisions of algebraic expressions that we discussed in this chapter.
**Dividend = Divisor × Quotient
or
**Dividend = Divisor × Quotient + Remainder
**➣ Learn All About Factorization- [Read Here!]
Chapter 13: Introduction to Graphs
This chapter introduces you to graphs, its types and line graph in detail how to read it, plot it on a graph paper. The use of graphical tools to show data is particularly effective in organizing and comprehending the information. The following are some examples of graphical methods:
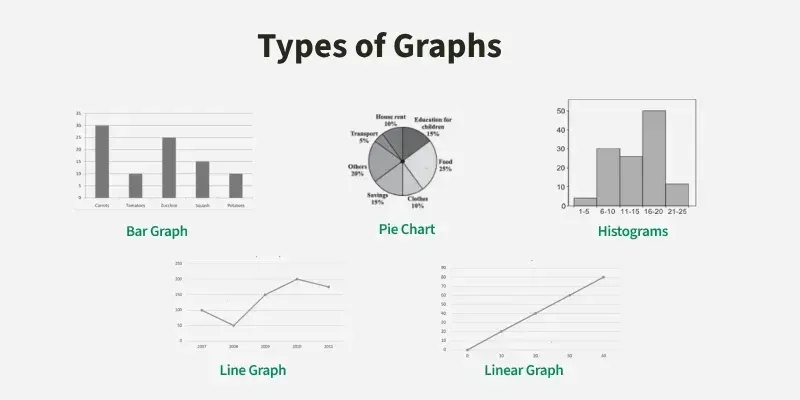
Types of Graphs
**Line Graph (Important)
A line graph will be beneficial in the situation of data that changes constantly over time.
- Uses points connected by straight lines.
- Shows change over time.
**Bar Graph
When comparing categories, the bar graph is the most appropriate tool.
- Represents **data using rectangular bars.
- Length of the bar = value of the data.
- Bars can be **vertical or horizontal.
- Used to compare **different categories.
**Pie Graph (Circle Graph)
Pie charts are the best way to compare sections of a whole.
- A circular chart divided into sectors (slices).
- Each sector represents a part of the whole.
- The full circle = 360°.
**Formula to calculate angle:
Angle of a sector = (Value/Total) × 360∘
**Histogram
A histogram may be used to make data simpler to interpret when it is presented in intervals.
- A graph of class intervals (groups) vs frequency.
- Bars are adjacent (no gaps).
- Used for continuous data like age groups, marks ranges.
Linear Graphs
A linear graph is a graph that represents a straight-line relationship between two variables.
- Special type of line graph where the plotted points lie on a **straight line.
- Represents **linear relationships (like y = 2x + 3).
**➣ Learn All About Types of Graphs in Maths- [Read Here!]