Extreme haplotype variation in the desiccation-tolerant clubmoss Selaginella lepidophylla (original) (raw)
- Article
- Open access
- Published: 02 January 2018
Nature Communications volume 9, Article number: 13 (2018)Cite this article
- 8324 Accesses
- 75 Citations
- 20 Altmetric
- Metrics details
Subjects
Abstract
Plant genome size varies by four orders of magnitude, and most of this variation stems from dynamic changes in repetitive DNA content. Here we report the small 109 Mb genome of Selaginella lepidophylla, a clubmoss with extreme desiccation tolerance. Single-molecule sequencing enables accurate haplotype assembly of a single heterozygous S. lepidophylla plant, revealing extensive structural variation. We observe numerous haplotype-specific deletions consisting of largely repetitive and heavily methylated sequences, with enrichment in young Gypsy LTR retrotransposons. Such elements are active but rapidly deleted, suggesting “bloat and purge” to maintain a small genome size. Unlike all other land plant lineages, Selaginella has no evidence of a whole-genome duplication event in its evolutionary history, but instead shows unique tandem gene duplication patterns reflecting adaptation to extreme drying. Gene expression changes during desiccation in S. lepidophylla mirror patterns observed across angiosperm resurrection plants.
Introduction
The ability to survive periodic drying was essential for the aquatic ancestors of terrestrial plants during their transition from sea to land. These early protective mechanisms are thought to be ancestral and conserved in most land plants1, forming the basis of modern seed and pollen desiccation pathways2. A small group of plants have maintained this ancestral desiccation tolerance, surviving near complete anhydrobiosis (<10% relative water content) during prolonged drought events. Desiccation tolerance is widespread in non-seed plants such as mosses, ferns, and lycophytes3, 4, but is uncommon in angiosperms. High-quality genomes for several angiosperm resurrection plants have shed light on the molecular basis of desiccation tolerance2, 5, 6, but the sparse genomic resources for non-seed plants has hindered progress toward understanding the origin of this trait.
Here we report the small genome of Selaginella lepidophylla, a lycophyte that can survive the loss of >95% cellular water for decades in a quiescent state. Selaginella are among the earliest diverging lineages of vascular plants, and extant species bear striking morphological similarities to fossils from the upper Carboniferous (333–350 Myr ago)7, 8. Genome size variation within this ancient group is minimal and Selagienlla are the only clade of land plants with no shared whole-genome duplication event9. Detailed comparative genomics across angiosperms and with the S. moellendorffii genome10 shed light the origin of desiccation tolerance and unique properties of Selaginella.
Results
Haplotype-level genome assembly and annotation
Extensive within genome heterozygosity exists for most plant species, and this variation enhances fitness and serves as a reservoir for adaptive evolution. Heterozygosity is a major issue in plant genome assembly, and most heterozygous plant genomes are highly fragmented with collapsed haplotype regions11. S. lepidophylla has an estimated genome size of 109 Mb based on kmer frequency analyses, which is consistent with the small genomes observed across the genus9. Despite its compact size, the S. lepidophylla genome is highly heterozygous, with a bimodal distribution of kmers corresponding to distinct heterozygous and collapsed homozygous regions (Supplementary Fig. 1). Initial sequencing attempts using an Illumina only approach yielded a highly collapsed and fragmented assembly of 21,282 scaffolds, totaling 54 Mb, with an N50 of 3 kb (Supplementary Table 1). To overcome assembly issues related to heterozygosity, we generated 175× coverage (19.3 Gb) of single-molecule real-time (SMRT) sequences from PacBio with a filtered subread N50 length of 18 kb (Supplementary Fig. 2). The long read lengths of PacBio sequencing facilitate accurate separation and assembly of heterozygotic haplotypes12. Raw PacBio reads were error corrected and assembled using the Canu assembler13, which utilizes optimized overlapping and assembly algorithms to avoid collapsing repetitive regions and haplotypes. The resulting contigs were polished using the raw PacBio data with Quiver14, followed by a second round of polishing with Pilon15 using the high-coverage Illumina data.
The final S. lepidophylla assembly spans 122 Mb across 1149 contigs with an N50 length of 163 kb (Supplementary Table 2). These assembly metrics are similar to the S. moellendorffii genome (contig N50 length = 120 kb), which was sequenced using a reiterative Sanger approach10. Our assembly includes 15 of the 20 terminal telomere tracks (2_n_ = 20) and 128 rRNA arrays, which are typically unassembled in most next-generation sequencing (NGS) based genomes11. The S. lepidophylla assembly graph is highly complex with numerous interconnected edges, reflecting bubbles and ambiguities caused by heterozygous regions (Fig. 1). The long PacBio reads assembled 930 haplotype blocks spanning 33.7 Mb of separated haplotype sequences (Methods section; Fig. 2a; Supplementary Fig. 3). Other haplotype aware assemblers were tested but Canu provided the best separation of haplotype blocks as well as the best contiguity.
Fig. 1
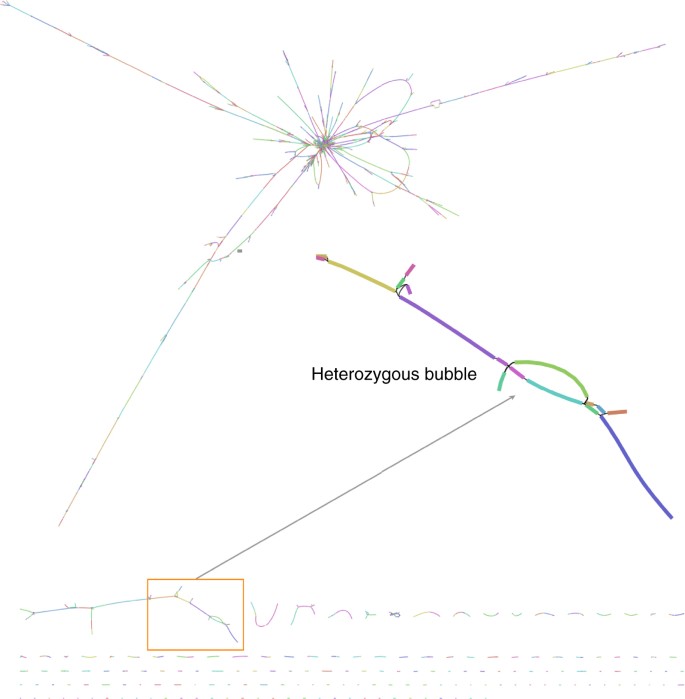
Genome assembly graph of S. lepidophylla. Each line (node) represents a contig with connections (edges) representing ambiguities in the graph structure. A subset of the graph showing heterozygous bubbles is enlarged. Contig color is randomly assigned
Fig. 2
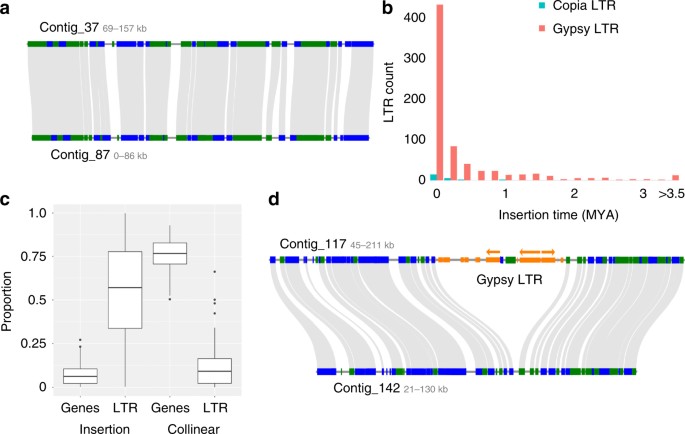
Extensive haplotype-specific LTR retrotransposon accumulation and deletion. a Typical micro-collinearity between two S. lepidophylla haplotypes. b Estimated insertions times of intact Copia and Gypsy LTR retrotransposons. c Composition of haplotype specific and paired collinear regions. The proportion of genes and LTRs in the 105 manually curated insertions (left) and flanking collinear regions (right) are plotted. d Micro-collinearity between two haplotypes showing a large 57 kb deletion in contig 142. Green and blue bars delineate gene orientation. Predicted LTR elements are depicted in orange and the three complete Gypsy LTRs are denoted by arrows. The three complete Gypsy LTRs have insertion times of <0.1 Ma
We annotated 27,204 genes across a deduced 89 Mb haploid assembly, considerably more than S. moellendorffii (22,285 genes)10. The majority (96%) of core eukaryotic BUSCOs16 were identified in the gene set, supporting the completeness of the genome assembly and quality of the annotation (Supplementary Table 3). Roughly 45% of genes (11,847) are found in duplicated pairs across the full 122 Mb assembly with an average protein homology of 99.1%. Gene density in S. lepidophylla is 4.0 kb per gene, which is higher than S. moellendorffi 10 and Arabidopsis17, but lower than the smallest sequenced plant genome (82 Mb) of Utricularia gibba 18.
Genome evolution and haplotype-specific structural variation
Genome size varies by four orders of magnitude across land plants, ranging from 60 Mb in the carnivorous Genlisea to 152,000 Mb in Paris japonica. Lycophytes have a narrow variation in genome size compared to angiosperms19, and Selaginella sizes range from 90 to 182 Mb9. Rapid changes in genome size are driven by bursts of long terminal repeat (LTR) retrotransposon proliferation followed by aggressive deletion through unequal homologous recombination and double-strand break repair20. LTR elements are distributed non-randomly across the genome with _Gypsy-_like elements predominantly found in gene poor and repeat rich blocks while _Copia_-like elements are dispersed among genes (Supplementary Table 4). Most of the LTR elements are clustered in a relatively small number of LTR families (Supplementary Figure 4). We identified 744 full-length LTR retrotransposons (LTR-RTs), including 572 Gypsy and 17 Copia elements (Supplementary Table 5). The majority of intact LTRs are relatively young, with average insertion times of 0.1 and 0.4 MYA for Copia and Gypsy elements, respectively, and most intact LTR elements are younger than 0.5 Ma (Fig. 2b and Supplementary Fig. 5). The proportion of young LTR elements is higher in S. lepidophylla than other high-quality plant genomes (Supplementary Figure 5). The recent LTR amplification suggests most elements have been active recently in Selaginella but they are rapidly fragmented and deleted. S. lepidophylla has a much higher ratio (4.06, Wilcoxon rank-sum, P < 0.05, same statistical test hereafter unless specified) of solo-intact LTR elements comparing to the genomes of rice and Arabidopsis (2.71 and 1.80, respectively) (Supplementary Fig. 6), indicating more effective removal of LTR-RTs via unequal homologous recombination. Moreover, the average age of LTR families in S. lepidophylla is much younger (0.37 MY vs. 0.92 and 0.94 MY, respectively; P < 0.05) under the mutation rate of μ = 1.3 × 10⁻⁸ (per bp per year), suggesting rapid removal of LTR elements. The intensive and rapid removal of LTR-RTs is likely one of the causes of haplotype variation and enrichment of LTR-RTs (Fig. 2).
Haplotype blocks within the S. lepidophylla genome are largely collinear, with conserved gene content and 98.2% sequence homology (Fig. 2a; Supplementary Fig. 3). However, since our analysis is based on both the number of contiguous protein and sequence homology, it is possible that we have missed large highly diverged haplotype blocks. A detailed comparison uncovered 104 large-scale haplotype-specific insertions or deletions (indels) across the genome. These high-confidence indels collectively span 2.5 Mb among 13.5 Mb of collinear sequences (18.5%) with individual sizes ranging from 4.8 kb to 85 kb with an average size of 24 kb (Supplementary Table 6). This is likely an underestimation as separate haplotypes were assembled for 35% of the genome and only high-confidence collinear regions spanning >75 kb were surveyed. Haplotype-specific regions are largely repetitive with 58% of bases consisting of LTR retrotransposons and only 9% genes (Fig. 2c). Flanking collinear regions show the opposite trend, with 86% genic and only 11% LTR retrotransposon sequences. We annotated 335 protein-coding genes in the gene poor, haplotype-specific regions, but most (74%; 248 genes) have little to no detectable expression (TPM <0.5). Young LTR retrotransposons (insertion times <0.1 Ma) are over-represented in haplotype-specific regions, supporting a recent origin of these indels (Fig. 2d; P < 0.01).
DNA methylation is associated with suppressing repetitive element proliferation and larger, repeat-dense plant genomes tend to have higher levels of methylation21. We surveyed genome-wide DNA methylation in S. lepidophylla for patterns related to repetitive element silencing. Similar to other non-seed vascular plants22, 23, S. lepidophylla lacks evidence of any gene body methylation (Fig. 3a). In contrast, intact LTR retrotransposons have high levels of CpG and CHG methylation with comparatively little CHH methylation (Fig. 3b). Methylation is highest in the body of LTR retrotransposons with levels dropping at the 5′- and 3′-flanking regions. Gene rich regions of the S. lepidophylla genome are highly compact with an average of 1.1 kb intergenic sequences with interspersed, repeat-dense blocks (Fig. 3c). This creates large tracks in the genome that are essentially devoid of methylation flanked by densely methylated, likely heterochromatic regions.
Fig. 3
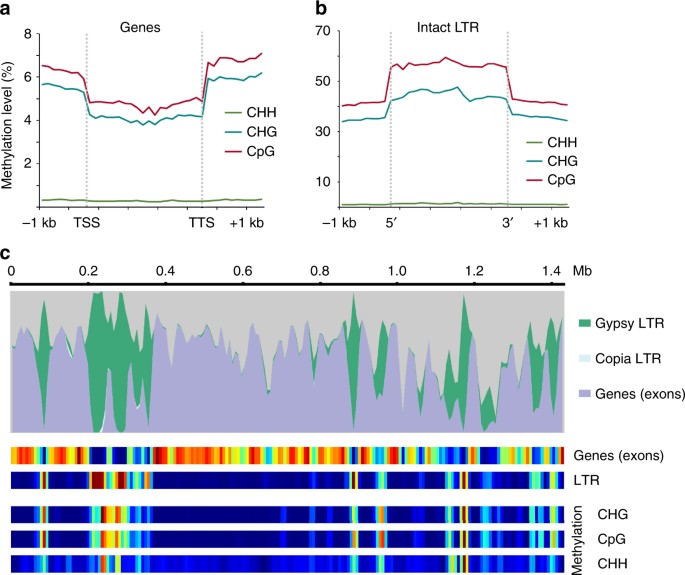
Global methylation patterns in the S. lepidophylla genome. a S. lepidophylla lacks gene body methylation. Levels of CHH (green), CHG (blue) and CpG (red) methylation are plotted in the upstream (transcriptional start site; TSS), downstream (transcriptional termination site (TTS), and body of genes. b Intact LTR retrotransposons are highly methylated with decreasing levels at the 5′- and 3′-flanking regions. c Methylation levels are highly variable across the genome with strong correlation of LTR retrotransposon density. Top, genome landscape of genomic features across Contig 1. Bottom, heatmap of genomic features and methylation levels, where blue indicates low abundance and red signifies high abundance
Comparative genomics across Selaginella and angiosperms
Selaginella arose in the early Carboniferous period 333–350 MYA8, and the ancestors of S. lepidophylla and S. moellendorffii diverged about 250 MYA9, well before the radiance of modern angiosperms24. Despite this separation, both lineages have maintained a similar genome size (~ 100 Mb) and neither has experienced a recent whole-genome duplication event, contrasting patterns observed in all other land plants10, 25. S. lepidophylla and S. moellendorffii have maintained a surprising degree of collinearity with 36% (7849) of S. moellendorffi genes showing conserved order in S. lepidophylla. Genic regions are generally more compact in S. lepidophylla, correlating with the higher TE content (37.5%) in S. moellendorffii (Supplementary Fig. 7). By contrast, only ~ 15% of rice and core eudicot genes are collinear26, reflecting the role of WGD events in shaping gene order and genome architecture. In the absence of WGD, any new traits and adaptations associated with duplicate genes in Selaginella must arise through local or segmental gene duplications27. S. moellendorffii has significantly more tandem gene duplications (TD) than S. lepidophylla with 6693 compared to 4170, but both share similar enrichment pattern (Supplementary Tables 7–10). TDs in Selaginella are enriched in molecular function GO terms related to kinase activity, ion and other small molecule binding among others (Supplementary Tables 7 and 9). Few TDs were annotated as transcription factors or highly connected metabolic genes, which is consistent with expectations under the gene balance hypothesis[28](/articles/s41467-017-02546-5#ref-CR28 "Birchler, J. A. & Veitia, R. A. The gene balance hypothesis: From classical genetics to modern genomics. Plant. Cell 19, 395–402, https://doi.org/10.1105/tpc.106.049338
               (2007)."), [29](/articles/s41467-017-02546-5#ref-CR29 "Bekaert, M., Edger, P. P., Pires, J. C. & Conant, G. C. Two-phase resolution of polyploidy in the Arabidopsis metabolic network gives rise to relative and absolute dosage constraints. Plant. Cell
                       23, 1719–1728 (2011)."). Both _Selaginella_ species have overlapping KEGG pathway enrichments across TDs including phenylpropanoid, cutin, and secondary metabolite metabolism (Supplementary Tables [8](/articles/s41467-017-02546-5#MOESM1) and [10](/articles/s41467-017-02546-5#MOESM1)). _S. lepidophylla_ has TDs enriched in phagosome pathways, which may be related to controlled autophagy during desiccation[30](/articles/s41467-017-02546-5#ref-CR30 "Williams, B. et al. Trehalose accumulation triggers autophagy during plant desiccation. PLoS Genet.
                       11, e1005705 (2015).").
Lycophytes are sister to all other vascular plants including angiosperms, the most diverse extant plant group on the planet. We surveyed changes in orthogroup composition across angiosperms and the two Selaginella species to identify patterns associated with WGD and life history traits. We identified 5891 orthogroups with representatives from every species and 69 orthogroups with expansion in angiosperms (Supplementary Table 11). Angiosperm-dominated orthogroups have diverse GO terms and enriched KEGG pathways for alkaloid biosynthesis, proteolysis, and plant-pathogen interactions (Supplementary Tables 12 and 13). The angiosperm biased orthogroups are more highly connected than expected by chance (~ 2.7 edges per gene; P ≤ 10−20, Fisher’s exact test), fitting expectations for gene duplicates retained from WGD[28](/articles/s41467-017-02546-5#ref-CR28 "Birchler, J. A. & Veitia, R. A. The gene balance hypothesis: From classical genetics to modern genomics. Plant. Cell 19, 395–402, https://doi.org/10.1105/tpc.106.049338
(2007)."). The 55 Selaginella-biased orthogroups have GO enrichment in vesicle related processes and KEGG pathway enrichment in phenylpropanoid biosynthesis (Supplementary Tables [14](/articles/s41467-017-02546-5#MOESM1) and [15](/articles/s41467-017-02546-5#MOESM1)). Most _Selaginella_\-biased orthogroups are unique and completely uncharacterized, reflecting the need for more functional studies in other major plant lineages.Origins and evolution of desiccation tolerance
The transition from sea to land posed unique challenges for the ancestors of terrestrial plants. Early land plants needed to evolve protective mechanisms to survive periodic drying and low atmospheric water potential. Desiccation tolerance in angiosperms likely evolved from rewiring seed desiccation pathways2, but the origins of this trait in non-seed plants is unknown. We surveyed gene expression changes during the desiccation and rehydration process in S. lepidophylla and compared patterns to angiosperm resurrection plants. S. lepidophylla can survive for years or even decades in a desiccated state without loss in viability. Samples were taken from S. lepidophylla plants that were desiccated (0 h), 1, 6, and 24 h post rehydration (recovery), 120 h post rehydration (fully recovered), and after a 24 h dehydration (Fig. 4a). Despite prolonged quiescence, 77% of genes (21,062) have detectable expression in desiccated leaf tissue, implicating strong protective mechanisms to preserve the mRNA pool.
Fig. 4

Genomic features of the rehydration and desiccation processes. a Overview of sampling for the rehydration and desiccation time course. Samples were taken from plants that were desiccated for 3 years (0), 1, 6, and 24 h post rehydration (recovery), 120 h post rehydration (fully recovered), and after a 24 h dehydration (de24 h). b Scaled transcript expression profiles (in transcripts per million, TPM) of representative gene co-expression clusters with decreased (10, 16, 34) and increased expression (5, 14, 34) during rehydration. c Heatmap of log2 transformed early light-induced protein (ELIP) expression with the two arrays of tandem duplicated genes in S. lepidophylla orthologous to the only ELIP in to S. moellendorffii highlighted on the left
We performed gene-co-expression analysis across the rehydration and subsequent dehydration RNAseq timecourse data. The 38 co-expression clusters fall under the following three general patterns with (1) high expression in desiccated tissues followed by decreases during rehydration, (2) increased expression during rehydration, and (3) steady expression across all samples (Fig. 4b, Supplementary Fig. 8). Transcript levels are relatively consistent across the 0, 1, and 6 h post-rehydration time-points, with only 123 and 567 differentially expressed genes, respectively (0 h vs. 1 h and 1 h vs. 6 h). Clusters with increased expression during rehydration are enriched with functions related to DNA repair, oxidative and water stress response among others. Clusters with high expression in desiccated tissues and low expression during rehydration have functions related to cell protection and osmoprotectant accumulation as described in more detail below.
Gene duplications drive evolutionary innovation and tandem gene duplications (TDs) are important for adaptive evolution in dynamic environments31. Several clusters with peak expression during desiccation are enriched in TDs, including many with previously characterized roles in desiccation tolerance (Cluster 5, fdr = 1.26 e−16; Supplementary Fig. 9). Early light-induced proteins (ELIPs) protect photosynthetic apparatus against photo-oxidative damage under high light and other abiotic stresses32. Land plants typically have 1–2 ELIPs but S. lepidophylla has undergone a major expansion to 23 ELIPs. Most ELIPs are located in three tandem arrays with 8, 7, and 2 members, and the largest array is syntenic to the single ELIP found in S. moellendorffii (Fig. 4c). ELIPs are universally highly expressed during desiccation and show co-expression with other desiccation-related genes including heat-shock proteins, DNA repair enzymes, oleosins, LEAs, and others (enriched in cluster 10, fdr = 6.70 e−23, Fig. 3c; Supplementary Table 16). A similar expansion of ELIPs was identified in the resurrection plant Boea hygrometrica 6, suggesting these proteins are likely involved in the convergent evolution of desiccation tolerance.
LEA proteins function in membrane stability and macromolecular protection with roles in seed development, response to abiotic stresses, and desiccation tolerance in angiosperm resurrection plants2, 33, 34. S. lepidophylla has an expansion in LEA proteins compared to S. moellendorffii with 65 vs 36 across six LEA subfamilies (Supplementary Table 17). The LEA2 and seed maturation protein (SMP) subfamilies show the most dramatic expansion with 31 and 11 members, respectively. LEAs are dispersed across the genome and few are found in tandem arrays. LEAs are among the most highly expressed transcripts in the S. lepidophylla desiccation/rehydration timecourse with 48 showing significant expression changes (Supplementary Fig. 10). Interestingly, LEAs are also highly expressed in well-hydrated tissues, suggesting they may be involved in constitutive protective mechanisms, similar to several osmoprotectants.
Desiccation-related genes are found in large tandem arrays in the S. lepidophylla genome with individual genes having similar expression patterns. This reflects the importance of TD in the evolution of novel traits and the advantages of gene proximity for coordinated expression. Patterns of gene expression during desiccation in S. lepidophylla mirror the pathways activated in angiosperm resurrection plants. These pathways were either independently co-opted through convergent evolution in both lineages or present in the common ancestor of early land plants. The latter explanation is more likely as dehydration tolerance was acquired during the colonization of land. This hypothesis can be further refined with additional non-seed resurrection plant genomes.
The extreme haplotype-specific variation in Selaginella has not been observed in other sequenced plant genomes. This dynamic flux of accumulating and purging sequences likely serves two purposes. Strong selective pressures for removal of excess LTR retrotransposons act to preserve proper gene and _cis_-element spacing, which in turn maintains the small genome size. Unequal crossing over between divergent haplotypes and LTR-mediated gene duplications create a reservoir of new genes to facilitate adaptive evolution. In this context, haplotype-specific gene content may supplement the diversity lost in the absence of WGD.
Methods
DNA extraction and sequencing
The Selaginella lepidophylla plants used in this study were collected in the Chihuahuan Desert in the Southwestern US. These plants were confirmed to be S. lepidophylla based on sequence homology to published vouchered specimens with the following nucleotide identities based on BLAST: rbcL (99.6%; GenBank: AF419051.1) ITS2 (99.8%; GenBank: AF419002.1) 28S (99.8%; GenBank: AJ507594.1). Desiccated plants were stored at 20 °C in dark conditions for roughly 3 years prior to this experiment. Rehydrated plants were maintained in growth chambers under 24 °C day, 20 °C night, 12-h photoperiod, and 200 μmol m−2 s−1 light. High-molecular-weight genomic DNA was extracted from young leaf tissue of a single S. lepidophylla plant using a modified nuclei preparation35 followed by phenol chloroform purification to remove residual contaminants. DNA quality was verified on a low-concentration agarose gel (0.5% W/V) prior to library construction. gDNA was sheared to a 30 kb target size followed by end repair and adapter ligation. The final library was size selected using a BluePippen size selection system (Sage Science) followed by purification using AMPure XP beads (Beckman Coulter). High-molecular-weight libraries were sequenced using the PacBio RsII instrument with P6C4 chemistry. A total of 21 SMRT cells were sequenced. A PCR-free Illumina DNAseq library was constructed using the same high-molecular weight DNA following the manufactories instructions. Paired end 300 bp reads were sequenced on an Illumina MiSeq platform yielding a total of 80× Illumina sequence coverage for error correction.
RNA extraction and sequencing
S. lepidophylla plants were maintained in growth chambers under 16-h-light/8-h-night regime at 22 ± 2 °C for desiccation/rehydration experiments. Sampling at the 0 h (desiccated), 24 and 120 h post rehydration and 24 h post dehydration were taken at T = 0 to avoid any variance associated with natural circadian oscillation. Sampling was done in triplicate with three biological replicates sequenced for each timepoint. The relative water content (RWC) for the S. lepidophylla rehydration time-course was calculated using the following equation: RWC = [(FW − DW)/(SW − DW)], where FW, DW, and SW indicate fresh weight, dry weight, and saturated weight, respectively. DW was obtained after drying plant leaf tissue at 103 °C for 24 h and SW was obtained after submerging the leaf tissue in water for 36 h. RWC for each sample can be found in Supplementary Table 18. Total RNA was extracted from 100 mg of ground S. lepidophylla leaf tissues using Omega-biotek E.Z.N.A. Plant RNA Kit (Omega-biotek), according to the manufacturer’s instructions. Two micrograms of total RNA was used for construction Illumina TruSeq stranded mRNA libraries following the manufactures protocol (Illumina). Multiplexed pooled libraries were sequenced on the Illumina HiSeq4000 under paired-end 150 nt mode.
DNA extraction and methylation sequencing
Genomic DNA for methylation profiling was extracted from 500 mg of ground tissues using the CTAB method, followed by RNase digestion and column purification using Zymo Research genomic DNA clean & concentrator™ (Zymo Research). In total, 500 ng of genomic DNA was first sheared to an average size of 400–800 bp using Covaris M200. Libraries were constructed using KAPA Hyper Prep Kits (KapaBiosystem, #KK8504) according to the manufacturer’s protocol. The sheared DNA fragments were end-repaired and A-tailed followed by adapter ligation. Adapter-ligated fragments were subjected to bisulfite conversion using EZ DNA Methylation-Lightning™ Kit (Zymo Research). Bisulfite-converted DNA was amplified using KAPA HiFi HotStart Uracil + Ready Mix (KapaBiosystem) with 8 PCR cycles. PCR products were then size-selected by gel electrophoresis for the range of 300–600 bp and recovered by Zymoclean® Gel DNA Recovery Kit (Zymo Research). Multiplexed pooled libraries were sequenced on the Illumina HiSeq4000 platform under paired-end 150 nt mode.
Genome assembly
S. lepidophylla PacBio reads collectively span 19.3 Gb representing 175× genome coverage with a filtered subread N50 length of 18 kb. Raw reads were error corrected and assembled using the Canu (V1.4)13 assembler with the following parameters: minReadLength = 3000, GenomeSize = 110 Mb, and minOverlapLength = 2000. Other Canu parameters were left as default. The Falcon assembler (V0.3.0) was also tested but the overall contiguity was much lower (N50–110 kb) and a higher proportion of haplotypes were collapsed. Contigs were polished using a reiterative approach with two rounds of Quiver (V2.3.0)14 with a minimum subread length = 5000 bp, minimum polymerase read quality = 0.8, maximum divergence percentage = 30 and minimum anchor size = 15. The polished contigs underwent a final round of error correction using high-coverage 300 bp PE Illumina data using Pilon (V1.21)15. Quality trimmed Illumina reads were aligned to the Quiver polished contigs using bowtie2 (V2.3.0)36 with default parameters. Reads were locally re-aligned around insertions/deletions (indels) using the IndelRealigner from the genome analysis tool kit (GATK; V3.7)37. Pilon parameters were as follows: --flank 7, --K 51, and --mindepth 30. Illumina reads were re-aligned to the final polished genome to verify no residual errors remained using GATK.
Identification of haplotype-specific regions
Assembled haplotypes were identified using a two-step approach based on gene level microsynteny followed by whole-genome alignment. Gene synteny avoided spurious hits and misclassification around repetitive elements with whole-genome alignment facilitating base-pair resolution of overlapping haplotype regions. Syntenic gene pairs were identified with BLAST followed by filtering for only collinear pairs using the MCSCAN toolkit (V1.1)38. This approach flagged 11,847 duplicated gene pairs collectively representing ~45% of genes across 28 Mb of the genome. The exact boundaries of haplotype overlaps and haplotype-specific structural variants were identified by whole-genome alignment using MUMmer (V3.0)39. The unmasked genome was aligned against itself using NUCmer with default parameters and a minimum overlap size of 2 kb. Only hits in contigs with collinear gene pairs were considered and overlaps in these regions were manually filtered removing misalignments in repetitive regions. In total, 33.7 Mb of assembled haplotype sequences were identified including 105 high-confidence haplotype-specific insertions/deletions (indel). The boundaries of each indel were manually refined using the GEvo module in CoGe (https://genomevolution.org)40. Haplotype-specific indels were verified through alignment of raw PacBio reads spanning the boundary regions in both haplotypes.
Transposable element identification
Non-autonomous DNA transposons in S. lepidophylla were identified by MITE-Hunter41 and were classified according to the sequence of termini and length of target site duplication (TSD) provided in the output from MITE-Hunter based on the guide of Zhao et al.42. Candidate long terminal repeat retrotransposons (LTR-RTs) in S. lepidophylla were identified using LTR_Finder (V1.02)43 and LTRharvest44. LTR_retriever45 was used to filter out false LTR retrotransposons using structural and sequence features of target site duplications, terminal motifs, and LTR-RT Pfam domains. Whole-genome annotation of LTR retrotransposons was done by RepeatMasker (http://www.repeatmasker.org/)46 using the non-redundant LTR-RT library constructed by LTR_retriever. DNA transposons that were nest-inserted in LTR retrotransposons were identified and removed in the LTR library using a Perl scrip “Purger.pl” from the LTR_retriever package. Non-LTR retrotransposons and other interspersed repeats were identified using RepeatModeler (V1.0.8) (http://www.repeatmasker.org). While RepeatModeler also reports LTR retrotransposons, their sequences were examined using TE-specific Pfam domains by HMMER (V3.1b2)47. Among 34 RepeatModeler-predicted LTR retrotransposons, none of them were exclusively matched with LTR-specific Pfam domains, thus all these sequences were labeled as unknown repeats instead of LTR retrotransposons. Candidate tandem repeats were identified by Tandem Repeat Finder (trf409.linux64)48 and were masked by the TEs identified in previous steps. Unmasked candidates were labeled as tandem repeats, and the sequence redundancy were reduced using Cd-hit (V4.6.6)49 with parameters -c 0.8, -G 0.8, -s 0.9, -aL 0.9, -aS 0.9, -M 0, and -T 5. The Perl script “Purger.pl” from LTR_retriever and the plant protein database “alluniRefprexp082813” from MAKER (V2)50 were used to remove any protein-coding sequences that were accidentally identified in these TEs. The top 10 most abundant repeat families (based on genome mass) were manually curated through alignment of multiple family members so to determine their boundary, termini, and TSD, which were used to classify the relevant repeat.
Solo LTRs were identified from the whole-genome annotation of LTR-RT using the Perl script “solo_finder.pl” in the LTR_retriever package. In brief, independent LTR sequences (no other LTR-related sequence presented in 300 bp distance) that cover at least 80% of the library LTR entry with alignment score >300 and at least 100 bp in length were identified as solo LTR. The solo-intact LTR ratio was calculated based on the number of solo LTR over the number of intact LTR-RT for each family, which was estimated using the Perl script “solo_intact_ratio.pl” in the LTR_retriever package. Since LTR length is positively correlated with the formation of solo LTRs, we only compared the S/I ratio using elements with comparable LTR length. This was achieved by using the 95 percentile of LTR length in S. lepidophylla (90–1540 bp) to screen for LTR-RT families within into this range in the rice and Arabidopsis genomes.
Estimation of insertion time for each intact LTR element was provided by LTR_retriever using the formula of T = K/2_μ_, where K is the divergence rate approximated by percent identity and adjusted using the Jukes-Cantor model for non-coding sequences. The neutral mutation rate of μ = 1.3 × 10⁻⁸ mutations per bp per year was used51.
Genome annotation
The S. lepidophylla genome was annotated using MAKER (V 2.31.8)52. A set of high-quality transcripts for gene prediction were assembled with StringTie (V1.3.1)53 using the stranded, paired end Illumina RNAseq data described above. Quality filtered RNAseq reads were aligned to the unmasked S. lepidophylla genome using TopHat (V2.1.0)54 and the accepted_hits.bam file was used as input for StringTie. Default parameters were used for StringTie with the --merge flag to produce a set of non-redundant transcripts to feed into MAKER. These transcripts were treated as expressed sequence tag evidence and protein sequences from Arabidopsis17, Selaginella moellendorffii 10, and UniprotKB plant databases55 were used as protein homology evidence. Intact S. lepidophylla LTR retrotransposons were input as a custom repeat database along with default repeat libraries in MAKER. Ab initio gene prediction was done using the gene predictors SNAP and Augustus with reiterative training in S. lepidophylla. The initial MAKER Max gene set was filtered for gene models with Pfam domain evidence and annotation edit distance <1.0. Putative transposon-derived models were removed. This produced a set of 39,051 filtered gene models. A further 11,847 duplicated gene models corresponding to separate haplotypes were removed to produce a final set of 27,204 non-redundant genes.
Orthogroup annotation
Orthogroups were identified using Orthofinder (V1.0.6)56 with protein-coding genes from the Arabidopsis17, rice57, poplar58, grape59, Oropetium thomaeum 60, S. moellendorffii 10, and S. lepidophylla genomes using default settings (Supplementary Table 11). We set a stringent cutoff of a 5 fold difference in orthogroup composition and at least a minimum of 10 genes (average) across either Angiosperms or Selaginella groups to identify expanded orthogroups. On average, angiosperm enriched orthogroups had 20-fold enrichment and Selaginella had 40 fold enrichment.
Gene expression analysis
Adapter sequences and low-quality bases were filtered from the raw, paired end Illumina RNAseq reads using TRIMMOMATIC (v0.33)61 and reads shorter than 36 bp were discarded. Expression levels (in Transcript Per Million, TPM) were quantified using Kallisto62 with the 27,204 monoploid S. lepidophylla gene models provided as input. An average TPM for each time-point was calculated from the mean TPM of the three biological replicates. We preformed weighted gene co-expression analysis of the dehydration and subsequent rehydration time course RNA-seq data with the R package WGCNA63. The expression data were pre-filtered to remove genes with excessive missing values or invariant expression using the built-in quality control function. A signed co-expression network was constructed using a soft-thresholding power of 10 and default parameters. The only exception was the mergeCutHeight parameter, controlling the minimum distance between co-expression clusters, which was set to 0.15. The co-expression network resulted in 38 clusters, with 13 genes not placed in any cluster.
MethylC-seq analysis
Quality filtered MethylC-seq reads were filtered as described above. Three replicates for 0 h, 24 h, and 120 h post rehydration and unconverted control DNA were sequenced. The average genome coverage of each library is 12.3×. Reads were mapped to the in silico converted, unmasked S. lepidophylla genome for the forward and reverse strands using Bismark (v0.12.0)64. Genome-wide cytosine methylation was obtained using the following parameters in the Bismark methylation extractor step: –comprehensive –CX_context --cytosine_report. The methylation level of each CHH, CHG, and CpG position was calculated as the number of methylated count/total of methylated and unmethylated count. Any position with coverage of less than three reads was removed. For each cytosine position, the average methylation level was calculated from the mean methylation level among biological replicates.
Methylation level of the upstream (1 kb), downstream (1 kb) and body (from transcription start site to transcription stop site) of all genic regions and intact LTR retrotransposons were calculated using BEDTools (v2.24.0)65 and in-house scripts. To study differential methylated regions between 0 h, 24 h, and 120 h post rehydration samples, the whole-genome methylated count of each library was obtained from the Bismark output. Differential methylated regions were analyzed using the R package methylKit (v1.2.0)66 in 100 bp window and minimum coverage of 10 reads per site.
Data availability
The genome assembly, raw PacBio, Illumina DNAseq, and RNAseq data are available from the National Center for Biotechnology Information (NCBI) Short Read Archive (SRA). The RNAseq reads were deposited to NCBI SRA under BioProject PRJNA420971 (BioSample SAMN08128719–08128734) and MethylCseq data were deposited under BioProject PRJNA421023 (BioSample SAMN08132846-08132853). The genome assembly has been deposited under BioSample SAMN07071123 and BioProject ID PRJNA386571.
References
- Oliver, M. J., Tuba, Z. & Mishler, B. D. The evolution of vegetative desiccation tolerance in land plants. Plant Ecol. 151, 85–100 (2000).
Article Google Scholar - Costa, M. et al. A footprint of desiccation tolerance in the genome of Xerophyta viscosa. Nat. Plants 3, 17038 (2017).
Article CAS PubMed Google Scholar - Proctor, M. The physiological basis of bryophyte production. Bot. J. Linn. Soc. 104, 61–77 (1990).
Article Google Scholar - Lüttge, U., Beck, E. & Bartels, D. Plant desiccation tolerance. Vol. 215 (Springer, 2011).
- VanBuren, R. et al. Single-molecule sequencing of the desiccation-tolerant grass Oropetium thomaeum. Nature 527, 508–511 (2015).
Article ADS CAS PubMed Google Scholar - Xiao, L. et al. The resurrection genome of Boea hygrometrica: A blueprint for survival of dehydration. Proc. Natl Acad. Sci. 112, 5833–5837 (2015).
Article ADS CAS PubMed PubMed Central Google Scholar - Banks, J. A. Selaginella and 400 million years of separation. Annu. Rev. Plant. Biol. 60, 223–238 (2009).
Article CAS PubMed Google Scholar - Thomas, B. A. Paleozoic herbaceous lycopsids and the beginnings of extant lycopodium sens lat. And Selaginella Sens. Lat. Ann. Mo. Bot. Gard. 79, 623–631 (1992).
- Baniaga, A. E., Arrigo, N. & Barker, M. S. The small nuclear genomes of Selaginella are associated with a low rate of genome size evolution. Genome Biol. Evol. 8, 1516–1525 (2016).
Article PubMed PubMed Central Google Scholar - Banks, J. A. et al. The Selaginella genome identifies genetic changes associated with the evolution of vascular plants. science 332, 960–963 (2011).
Article ADS CAS PubMed PubMed Central Google Scholar - Michael, T. P. & VanBuren, R. Progress, challenges and the future of crop genomes. Curr. Opin. Plant. Biol. 24, 71–81 (2015).
Article CAS PubMed Google Scholar - Chin, C.-S. et al. Phased diploid genome assembly with single-molecule real-time sequencing. Nat. Methods 13, 1050–1054 (2016).
Article CAS PubMed PubMed Central Google Scholar - Koren, S. et al. Canu: scalable and accurate long-read assembly via adaptive k-mer weighting and repeat separation. Genome Res. 27, 722–736 (2017).
Article CAS PubMed PubMed Central Google Scholar - Chin, C.-S. et al. Nonhybrid, finished microbial genome assemblies from long-read SMRT sequencing data. Nat. Methods 10, 563–569 (2013).
Article CAS PubMed Google Scholar - Walker, B. J. et al. Pilon: an integrated tool for comprehensive microbial variant detection and genome assembly improvement. PLoS ONE 9, e112963 (2014).
Article ADS PubMed PubMed Central Google Scholar - Simão, F. A., Waterhouse, R. M., Ioannidis, P., Kriventseva, E. V. & Zdobnov, E. M. BUSCO: assessing genome assembly and annotation completeness with single-copy orthologs. Bioinformatics 31, 3210–3212 (2015).
- Initiative, A. G. Analysis of the genome sequence of the flowering plant Arabidopsis thaliana. Nature 408, 796 (2000).
Article ADS Google Scholar - Ibarra-Laclette, E. et al. Architecture and evolution of a minute plant genome. Nature 498, 94–98 (2013).
Article ADS CAS PubMed PubMed Central Google Scholar - Leitch, I., Soltis, D., Soltis, P. & Bennett, M. Evolution of DNA amounts across land plants (Embryophyta). Ann. Bot. 95, 207–217 (2005).
Article CAS PubMed PubMed Central Google Scholar - Michael, T. P. Plant genome size variation: bloating and purgingDNA. Brief. Funct. Genomics 13, 308–317 (2014).
Article CAS PubMed Google Scholar - Niederhuth, C. E. et al. Widespread natural variation of DNA methylation within angiosperms. Genome Biol. 17, 194 (2016).
Article PubMed PubMed Central Google Scholar - Zemach, A., McDaniel, I. E., Silva, P. & Zilberman, D. Genome-wide evolutionary analysis of eukaryotic DNA methylation. Science 328, 916–919 (2010).
Article ADS CAS PubMed Google Scholar - Takuno, S., Ran, J.-H. & Gaut, B. S. Evolutionary patterns of genic DNA methylation vary across land plants. Nat. Plants 2, 15222 (2016).
Article CAS PubMed Google Scholar - Magallón, S., Gómez‐Acevedo, S., Sánchez‐Reyes, L. L. & Hernández‐Hernández, T. A metacalibrated time‐tree documents the early rise of flowering plant phylogenetic diversity. New Phytol. 207, 437–453 (2015).
Article PubMed Google Scholar - Jiao, Y. et al. Ancestral polyploidy in seed plants and angiosperms. Nature 473, 97–100 (2011).
Article ADS CAS PubMed Google Scholar - Tang, H. et al. Synteny and collinearity in plant genomes. Science 320, 486–488 (2008).
Article ADS CAS PubMed Google Scholar - Ohno, S. Evolution by Gene Duplication. (Springer-Verlag, 1970).
- Birchler, J. A. & Veitia, R. A. The gene balance hypothesis: From classical genetics to modern genomics. Plant. Cell 19, 395–402, https://doi.org/10.1105/tpc.106.049338 (2007).
Article CAS PubMed PubMed Central Google Scholar - Bekaert, M., Edger, P. P., Pires, J. C. & Conant, G. C. Two-phase resolution of polyploidy in the Arabidopsis metabolic network gives rise to relative and absolute dosage constraints. Plant. Cell 23, 1719–1728 (2011).
Article CAS PubMed PubMed Central Google Scholar - Williams, B. et al. Trehalose accumulation triggers autophagy during plant desiccation. PLoS Genet. 11, e1005705 (2015).
Article PubMed PubMed Central Google Scholar - Panchy, N., Lehti-Shiu, M. & Shiu, S.-H. Evolution of gene duplication in plants. Plant Physiol. 171, 2294–2316 (2016).
CAS PubMed PubMed Central Google Scholar - Hutin, C. et al. Early light-induced proteins protect Arabidopsis from photooxidative stress. Proc. Natl Acad. Sci. 100, 4921–4926 (2003).
Article ADS CAS PubMed PubMed Central Google Scholar - Gechev, T. S. et al. Molecular mechanisms of desiccation tolerance in the resurrection glacial relic Haberlea rhodopensis. Cell. Mol. Life Sci. 70, 689–709 (2013).
Article CAS PubMed Google Scholar - Challabathula, D. & Bartels, D. Desiccation tolerance in resurrection plants: new insights from transcriptome, proteome and metabolome analysis. Front. Plant Sci. 4, 482 (2013).
Google Scholar - Zhang, H. B., Zhao, X., Ding, X., Paterson, A. H. & Wing, R. A. Preparation of megabase‐size DNA from plant nuclei. Plant J. 7, 175–184 (1995).
Article CAS Google Scholar - Langmead, B. & Salzberg, S. L. Fast gapped-read alignment with Bowtie 2. Nat. Methods 9, 357–359 (2012).
Article CAS PubMed PubMed Central Google Scholar - McKenna, A. et al. The genome analysis toolkit: a MapReduce framework for analyzing next-generation DNA sequencing data. Genome Res. 20, 1297–1303 (2010).
Article CAS PubMed PubMed Central Google Scholar - Wang, Y. et al. MCScanX: a toolkit for detection and evolutionary analysis of gene synteny and collinearity. Nucleic Acids Res. 40, e49–e49 (2012).
Article ADS CAS PubMed PubMed Central Google Scholar - Kurtz, S. et al. Versatile and open software for comparing large genomes. Genome Biol. 5, R12 (2004).
Article PubMed PubMed Central Google Scholar - Lyons, E. & Freeling, M. How to usefully compare homologous plant genes and chromosomes as DNA sequences. Plant J. 53, 661–673 (2008).
Article CAS PubMed Google Scholar - Han, Y. & Wessler, S. R. MITE-Hunter: a program for discovering miniature inverted-repeat transposable elements from genomic sequences. Nucleic Acids Res. 38, e199 (2010).
Article PubMed PubMed Central Google Scholar - Zhao, D., Ferguson, A. A. & Jiang, N. What makes up plant genomes: The vanishing line between transposable elements and genes. Biochim. Biophys. Acta 1859, 366–380 (2015).
Article PubMed Google Scholar - Xu, Z. & Wang, H. LTR_FINDER: an efficient tool for the prediction of full-length LTR retrotransposons. Nucleic Acids Res. 35, W265–W268 (2007).
Article PubMed PubMed Central Google Scholar - Ellinghaus, D., Kurtz, S. & Willhoeft, U. LTRharvest, an efficient and flexible software for de novo detection of LTR retrotransposons. BMC Bioinformatics 9, 18 (2008).
Article PubMed PubMed Central Google Scholar - Ou, S. & Jiang, N. LTR_retriever: a highly accurate and sensitive program for identification of long terminal-repeat retrotransposons. Plant Physiol. DOI: https://doi.org/10.1104/pp.17.01310 (2017).
- Tarailo‐Graovac, M. & Chen, N. Using RepeatMasker to identify repetitive elements in genomic sequences. Curr. Protoc. Bioinformatics 4.10. 11-14.10. 14 (2009).
- Eddy, S. R. Accelerated profile HMM searches. PLoS Comput. Biol. 7, e1002195 (2011).
Article ADS MathSciNet CAS PubMed PubMed Central Google Scholar - Benson, G. Tandem repeats finder: a program to analyze DNA sequences. Nucleic Acids Res. 27, 573–580 (1999).
Article CAS PubMed PubMed Central Google Scholar - Li, W. & Godzik, A. Cd-hit: a fast program for clustering and comparing large sets of protein or nucleotide sequences. Bioinformatics 22, 1658–1659 (2006).
Article CAS PubMed Google Scholar - Holt, C. & Yandell, M. MAKER2: an annotation pipeline and genome-database management tool for second-generation genome projects. BMC Bioinformatics 12, 1–14 (2011).
Article Google Scholar - Ma, J. & Bennetzen, J. L. Rapid recent growth and divergence of rice nuclear genomes. Proc. Natl Acad. Sci. USA 101, 12404–12410 (2004).
Article ADS CAS PubMed PubMed Central Google Scholar - Cantarel, B. L. et al. MAKER: an easy-to-use annotation pipeline designed for emerging model organism genomes. Genome Res. 18, 188–196 (2008).
Article CAS PubMed PubMed Central Google Scholar - Pertea, M. et al. StringTie enables improved reconstruction of a transcriptome from RNA-seq reads. Nat. Biotechnol. 33, 290–295 (2015).
Article CAS PubMed PubMed Central Google Scholar - Trapnell, C., Pachter, L. & Salzberg, S. L. TopHat: discovering splice junctions with RNA-Seq. Bioinformatics 25, 1105–1111 (2009).
Article CAS PubMed PubMed Central Google Scholar - Boutet, E., Lieberherr, D., Tognolli, M., Schneider, M. & Bairoch, A. UniProtKB/Swiss-Prot: the manually annotated section of the UniProt KnowledgeBase. Methods Mol. Biol, 406, 89–112 (2007).
- Emms, D. M. & Kelly, S. OrthoFinder: solving fundamental biases in whole genome comparisons dramatically improves orthogroup inference accuracy. Genome Biol. 16, 157 (2015).
Article PubMed PubMed Central Google Scholar - Goff, S. A. et al. A draft sequence of the rice genome (Oryza sativa L. ssp. japonica). Science 296, 92–100 (2002).
Article ADS CAS PubMed Google Scholar - Tuskan, G. A. et al. The genome of black cottonwood, Populus trichocarpa (Torr. & Gray). science 313, 1596–1604 (2006).
Article ADS CAS PubMed Google Scholar - Jaillon, O. et al. The grapevine genome sequence suggests ancestral hexaploidization in major angiosperm phyla. Nature 449, 463–467 (2007).
Article ADS CAS PubMed Google Scholar - VanBuren, R. et al. Single-molecule sequencing of the desiccation-tolerant grass Oropetium thomaeum. Nature 527, 508–511 (2015).
- Bolger, A. M., Lohse, M. & Usadel, B. Trimmomatic: a flexible trimmer for Illumina sequence data. Bioinformatics 30, 2117–2120(2014).
- Bray, N. L., Pimentel, H., Melsted, P. & Pachter, L. Near-optimal probabilistic RNA-seq quantification. Nat. Biotechnol. 34, 525–527 (2016).
Article CAS PubMed Google Scholar - Langfelder, P. & Horvath, S. WGCNA: an R package for weighted correlation network analysis. BMC Bioinformatics 9, 1 (2008).
Article Google Scholar - Krueger, F. & Andrews, S. R. Bismark: a flexible aligner and methylation caller for Bisulfite-Seq applications. Bioinformatics 27, 1571–1572 (2011).
Article CAS PubMed PubMed Central Google Scholar - Quinlan, A. R. & Hall, I. M. BEDTools: a flexible suite of utilities for comparing genomic features. Bioinformatics 26, 841–842 (2010).
Article CAS PubMed PubMed Central Google Scholar - Akalin, A. et al. methylKit: a comprehensive R package for the analysis of genome-wide DNA methylation profiles. Genome Biol. 13, R87 (2012).
Article PubMed PubMed Central Google Scholar
Acknowledgements
R.V. was supported by Hatch (Award 1013240) and startup funds from MSU. S.O and N. J. were supported by the National Science Foundation (MCB-1121650 to N.J.)
Author information
Authors and Affiliations
- Department of Horticulture, Michigan State University, East Lansing, MI, 48824, USA
Robert VanBuren, Ching Man Wai, Shujun Ou, Ning Jiang & Patrick Edger - Plant Resilience Institute, Michigan State University, East Lansing, MI, 48824, USA
Robert VanBuren - Ecology, Evolutionary Biology and Behavior, Michigan State University, East Lansing, MI, 48824, USA
Shujun Ou, Ning Jiang & Patrick Edger - Department of Plant Biology, Michigan State University, East Lansing, MI, 48824, USA
Jeremy Pardo - Donald Danforth Plant Science Center, St. Louis, MO, 63132, USA
Doug Bryant & Todd C. Mockler - J. Craig Venter Institute, La Jolla, CA, 92037, USA
Todd P. Michael
Authors
- Robert VanBuren
You can also search for this author inPubMed Google Scholar - Ching Man Wai
You can also search for this author inPubMed Google Scholar - Shujun Ou
You can also search for this author inPubMed Google Scholar - Jeremy Pardo
You can also search for this author inPubMed Google Scholar - Doug Bryant
You can also search for this author inPubMed Google Scholar - Ning Jiang
You can also search for this author inPubMed Google Scholar - Todd C. Mockler
You can also search for this author inPubMed Google Scholar - Patrick Edger
You can also search for this author inPubMed Google Scholar - Todd P. Michael
You can also search for this author inPubMed Google Scholar
Contributions
R.V. designed and conceived research; T.P.M. performed Illumina and PacBio sequencing; R.V., J.W., S.O. and N.J. annotated genome features; J.W. and R.V. performed desiccation experiments, RNAseq, and MethylCseq experiments; R.V., J.W., S.O., J. P., D.B., T.C.M., P.E. and T.P.M analyzed data; R.V. wrote the paper. All authors read and approved the final manuscript.
Corresponding authors
Correspondence toRobert VanBuren or Todd P. Michael.
Ethics declarations
Competing interests
The authors declare no competing financial interests.
Additional information
Publisher's note: Springer Nature remains neutral with regard to jurisdictional claims in published maps and institutional affiliations.
Electronic supplementary material
Rights and permissions
Open Access This article is licensed under a Creative Commons Attribution 4.0 International License, which permits use, sharing, adaptation, distribution and reproduction in any medium or format, as long as you give appropriate credit to the original author(s) and the source, provide a link to the Creative Commons license, and indicate if changes were made. The images or other third party material in this article are included in the article’s Creative Commons license, unless indicated otherwise in a credit line to the material. If material is not included in the article’s Creative Commons license and your intended use is not permitted by statutory regulation or exceeds the permitted use, you will need to obtain permission directly from the copyright holder. To view a copy of this license, visit http://creativecommons.org/licenses/by/4.0/.
About this article
Cite this article
VanBuren, R., Wai, C., Ou, S. et al. Extreme haplotype variation in the desiccation-tolerant clubmoss Selaginella lepidophylla .Nat Commun 9, 13 (2018). https://doi.org/10.1038/s41467-017-02546-5
- Received: 21 September 2017
- Accepted: 08 December 2017
- Published: 02 January 2018
- DOI: https://doi.org/10.1038/s41467-017-02546-5
This article is cited by
Comments
By submitting a comment you agree to abide by our Terms and Community Guidelines. If you find something abusive or that does not comply with our terms or guidelines please flag it as inappropriate.