Exploratory Data Analysis (original) (raw)
Last Updated : 30 Apr, 2026
Exploratory Data Analysis (EDA) is an important step in data analysis where we explore, summarize, and visualize data to understand its structure, detect patterns, identify anomalies, test assumptions, and check relationships between variables before applying any machine learning or statistical models.
Importance
- Provides a clear understanding of the dataset, including the number of features, data types and data distribution.
- Reveals patterns and relationships between different variables in the data.
- Identifies errors and outliers that may affect analysis.
- Highlights the most important features useful for building models.
- Supports selecting suitable modelling techniques for better results.
Types of Exploratory Data Analysis
1. Univariate Analysis
Univariate analysis studies one variable at a time to understand its characteristics and distribution.
- **Histograms****:** Show how data values are distributed.
- **Box plots****:** Help detect outliers and show data spread.
- **Bar charts****:** Used for categorical variables.
**2. Bivariate Analysis
Bivariate analysis examines the relationship between two variables to understand how they interact or influence each other. Common techniques include:
- **Scatter plots: Show the relationship between two numerical variables.
- **Correlation coefficient: Measures the strength of the relationship between variables .
- **Cross-tabulation: Displays the relationship between two categorical variables.
- **Line graphs: Compare two variables over time to identify trends.
- **Covariance: Shows how two variables change together.
3. Multivariate Analysis
Multivariate analysis studies three or more variables together to understand complex relationships within the dataset. Common techniques include:
- **Pair plots: Show relationships between multiple variables at once.
- **Principal Component Analysis (PCA)****:** Reduces dimensionality while preserving important information.
- **Spatial analysis: Analyzes geographical patterns using maps and location-based data.
Steps for Performing Exploratory Data Analysis
EDA involves a set of steps that help us understand the data, find patterns, detect issues and prepare the data for further analysis or modelling. It can be performed using different tools like:
- **Python: Pandas for data manipulation, Matplotlib and Seaborn for visualizations and Plotly for interactive charts.
- **R: ggplot2 for visualizations, dplyr for data manipulation and tidyr for organizing data.
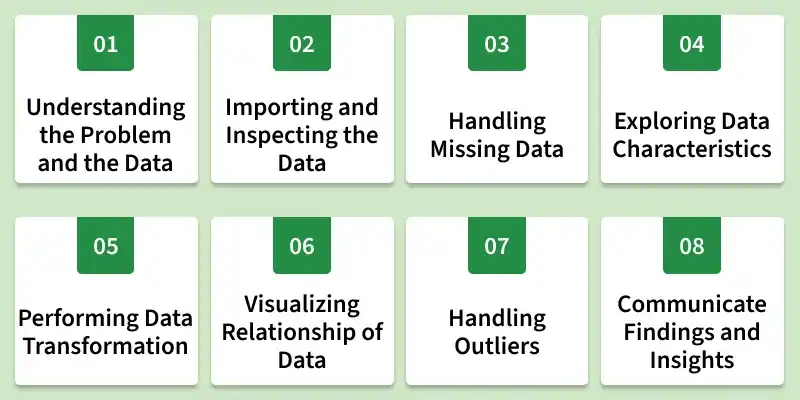
Common steps included in EDA
Step 1: Understanding the Problem and the Data
The first step in any data analysis project is to fully understand the problem we're solving and the data we have. This includes asking questions like:
- What is the goal or problem we are trying to solve?
- What variables are present in the dataset and what do they represent?
- What types of data are available (numerical, categorical, text etc.)?
- Are there any data quality issues or limitations?
Step 2: Importing and Inspecting the Data
The next step is to load the dataset into tools like Python or R and inspect it. These checks give a basic understanding of the dataset.
- Load the dataset properly.
- Check the number of rows and columns.
- Identify missing values.
- Verify the data type of each variable.
- Look for errors, invalid values or unusual data points.
Step 3: Handling Missing Data
Missing data is common in many datasets and can affect the quality of analysis. During EDA, it is important to identify and handle missing values properly to avoid incorrect results.
- Understand why data is missing, as this helps in selecting the right approach.
- Decide whether to remove or fill missing values, since removal can cause bias while imputation preserves data.
- Use suitable imputation methods such as mean, median, regression or machine learning techniques like KNN or decision trees.
- Consider the impact of missing data, as it can still introduce uncertainty even after imputation.
Step 4: Exploring Data Characteristics
After handling missing data, the next step is to examine the main characteristics of the dataset. This helps us understand how the data is distributed, detect unusual values and identify potential issues before further analysis.
- Check data distribution to understand how values are spread across the dataset.
- Measure central tendency using mean, median and mode to find the typical value of the data.
- Measure variability using standard deviation to see how much the values vary.
- Analyze distribution shape using skewness and kurtosis.
- Identify outliers or anomalies that may affect the analysis.
Step 5: Performing Data Transformation
Data transformation prepares the dataset for better analysis and modelling. Depending on the dataset, we may need to modify or convert the data so that it is in a suitable format for analysis.
- Scaling or normalizing numerical variables like min-max scaling or standardization.
- Encoding categorical variables for machine learning like one-hot encoding or label encoding.
- Applying mathematical transformations like logarithmic square root to correct skewness or non linearity.
- Creating new features by deriving useful information from existing variables
- Aggregating or grouping data based on specific variables or conditions.
Step 6: Visualizing Relationship of Data
Data visualization helps us understand patterns, trend and relationships in the dataset that may not be clear from numbers alone.
- Bar charts and pie charts help analyze categorical data distribution.
- Histograms, box plots and density plots show distribution and detect outliers in numerical data.
- Scatter plots and correlation measures help analyze relationships between variables.
Step 7: Handling Outliers
Outliers are data points that differ significantly from other observations. They may arise due to errors or genuine variations in the data.
- Using statistical methods such as Interquartile Range (IQR) or Z-score to identify extreme values.
- Analyze outliers carefully before taking any action.
- Use domain knowledge to determine whether they are valid or erroneous.
- Apply techniques like capping or transformation if necessary.
- Remove outliers only when they are clearly incorrect or harmful to analysis.
Step 8: Communicate Findings and Insights
The final step in EDA is to clearly present the results of the analysis. This helps others understand the insights discovered and the conclusions drawn from the data.
- State the goal and scope of the analysis.
- Provide background or context so the approach is easy to understand.
- Use visualizations to support findings and make results clearer.
- Highlight key insights, patterns, or anomalies discovered in the data.
- Mention limitations or challenges faced during the analysis.
- Suggest next steps or areas that require further investigation.
Application
- Market analysis and customer segmentation
- Risk assessment in finance and insurance
- Quality control in manufacturing
- Healthcare data analysis and disease prediction
- Recommendation systems and product optimization